A visual history of UK economics consultancy, drawn from a curated firm catalogue, filed accounts and 8,293 Companies House events.
90
Firms
£2.4418bn
Selected-entity turnover
8,293
Filings
25 yrs
Of history
↓ SCROLL TO BEGIN
Walk past 199 Bishopsgate on a weekday morning and you pass RBB Economics' registered address. Nothing on the door explains the economics upstairs. The firm's FY2025 accounts do: 18 LLP members, average profit per member above £3m and a highest-paid-member disclosure of £5.77m.
The series is built on numbers like these. They are large, verifiable and buried in accounts that few people outside the trade would think to open.
RBB is one firm in a specialist trade serving legal, regulatory and policy work. The project catalogue covers 90 firms associated with UK economics consultancy; it is curated, not a census. In the explorer, 30 selected legal entities with positive turnover observations report £2.4418bn in gross turnover. The figures are the latest for each entity, with year-ends ranging from July 2024 to December 2025. They include non-economics work inside broad and litigation consultancies, so the total is neither sector revenue nor a market floor.
Cebr reported sector revenue of £1.53bn for 2016/17 and historical average growth of 11.3% over three years. Extend that old rate mechanically for eight years and the result is £3.60bn for 2024/25. This is the author’s scenario, not Cebr’s forecast or a bound on the current market. The firms advise competition authorities, law firms, regulators and governments on mergers, regulatory proceedings and litigation. Filings and case records document much of that business-to-business work.
UK-registered firms file at Companies House in Cardiff. The accounts become public, indexed and free. Over twenty-five years the project found 8,293 filing events, including 1,664 sets of accounts; the extracted financial series has 1,335 account-year rows. Thirteen charts tell the story.
CHAPTER 01
The shape of the market
A 90-firm public catalogue, grouped by what each firm does and sized where current turnover is visible.
UK Economics Consultancy Universe
N=90 · GROUPED BY SEGMENT · SIZED BY LATEST UK REVENUE
TREEMAP
View on a laptop for the interactive chart.
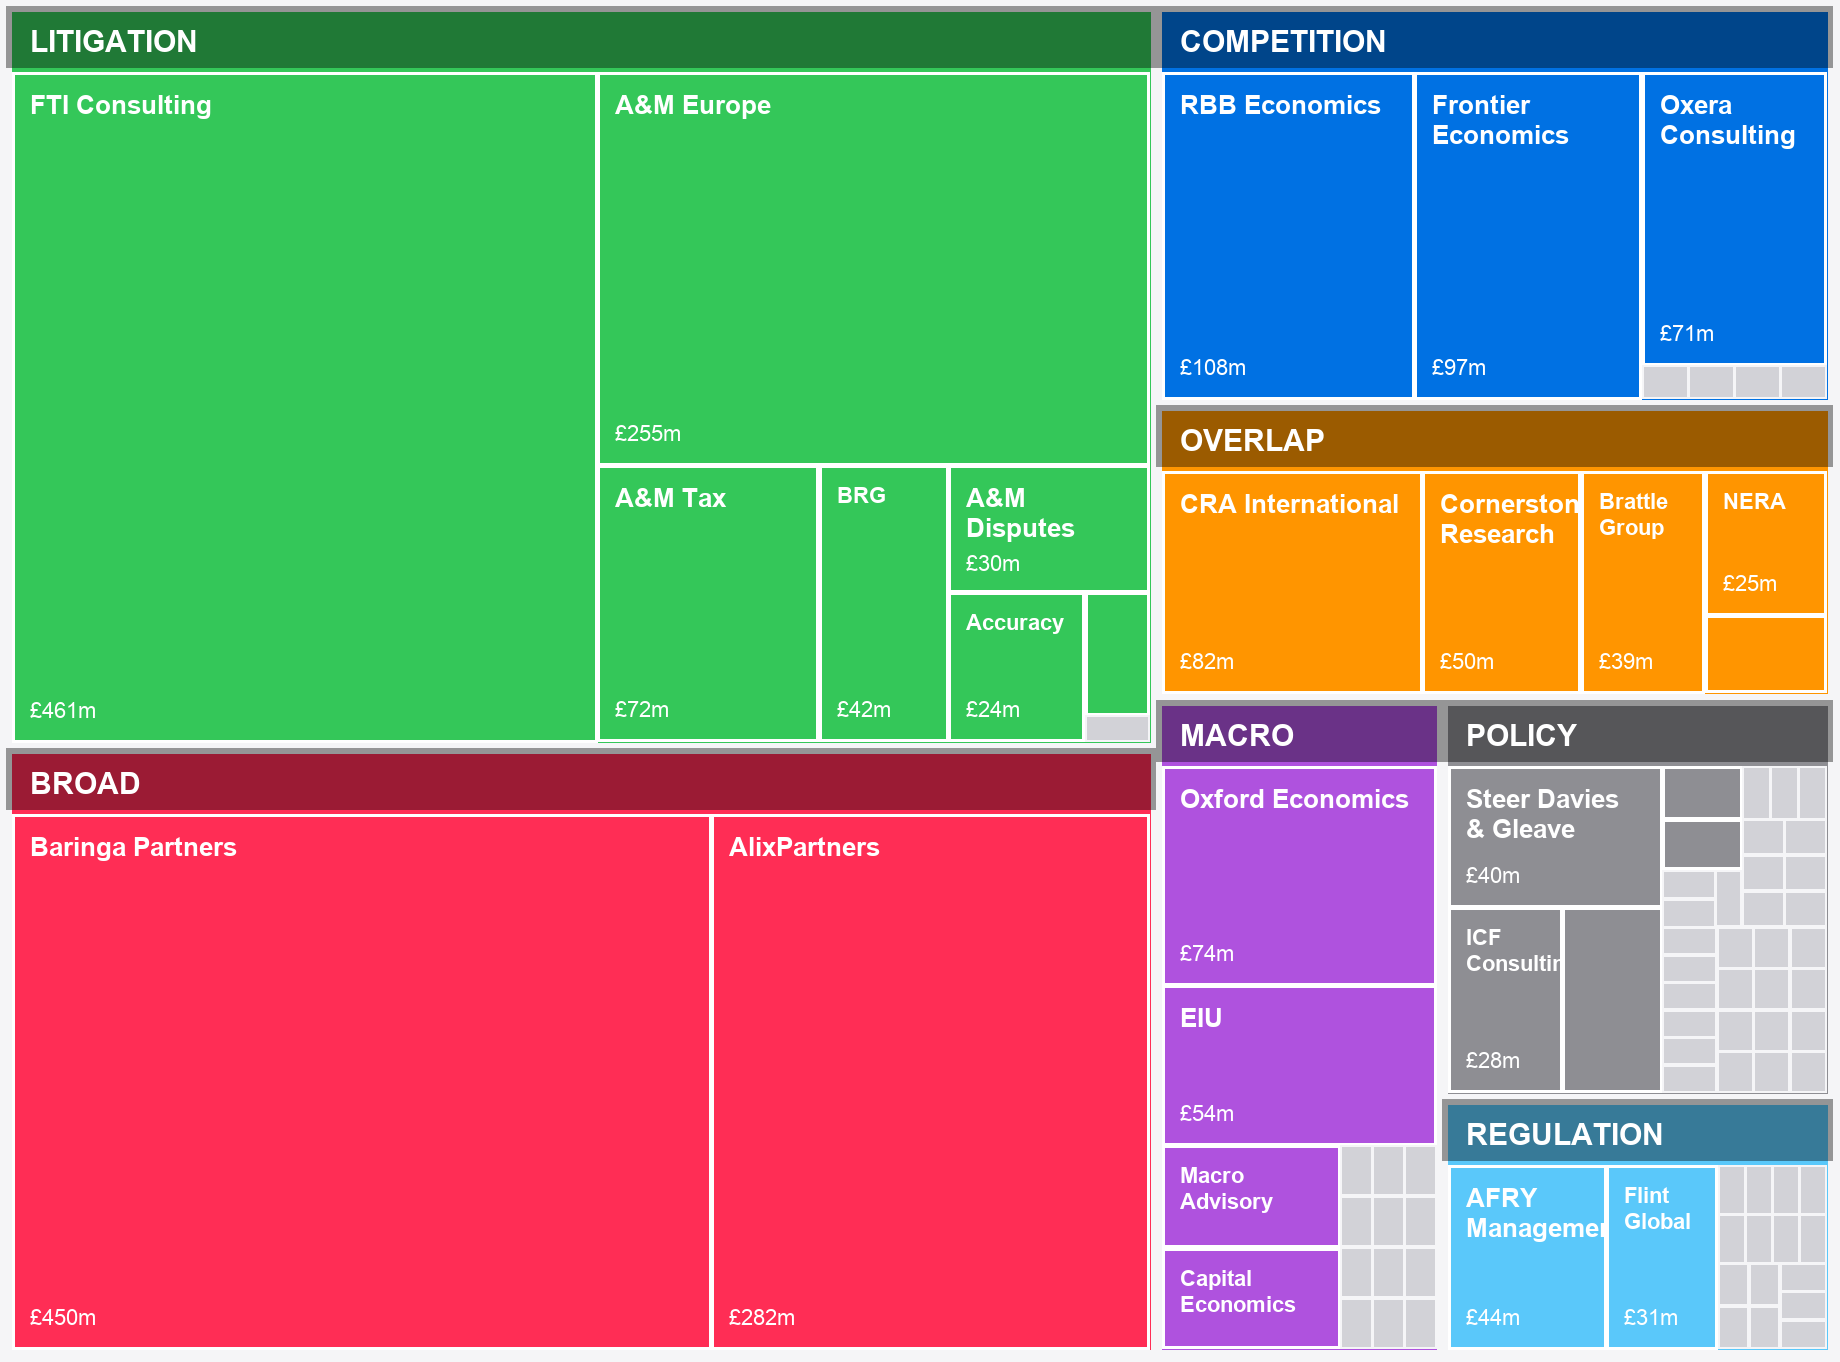
The catalogue has seven segments: policy contains 35 firms, regulation 17 and macro forecasting 16. Litigation and competition contribute another 15, including several high-revenue firms.
Where turnover is visible, it determines block size. The largest rectangles belong to the multi-practice advisers FTI Consulting, Baringa and A&M. Pure economics boutiques, selling formulas, expert reports and witness evidence, occupy medium-sized blocks in their own colour band.
THE INVISIBLE TAIL
Firms without a clean current turnover line remain as unsized rows. In the treemap they become equal tiles, ordered by category rather than revenue.
The chart measures what the accounts expose. The rest of the catalogue matters, but cannot be sized cleanly.
CHAPTER 02
The league table
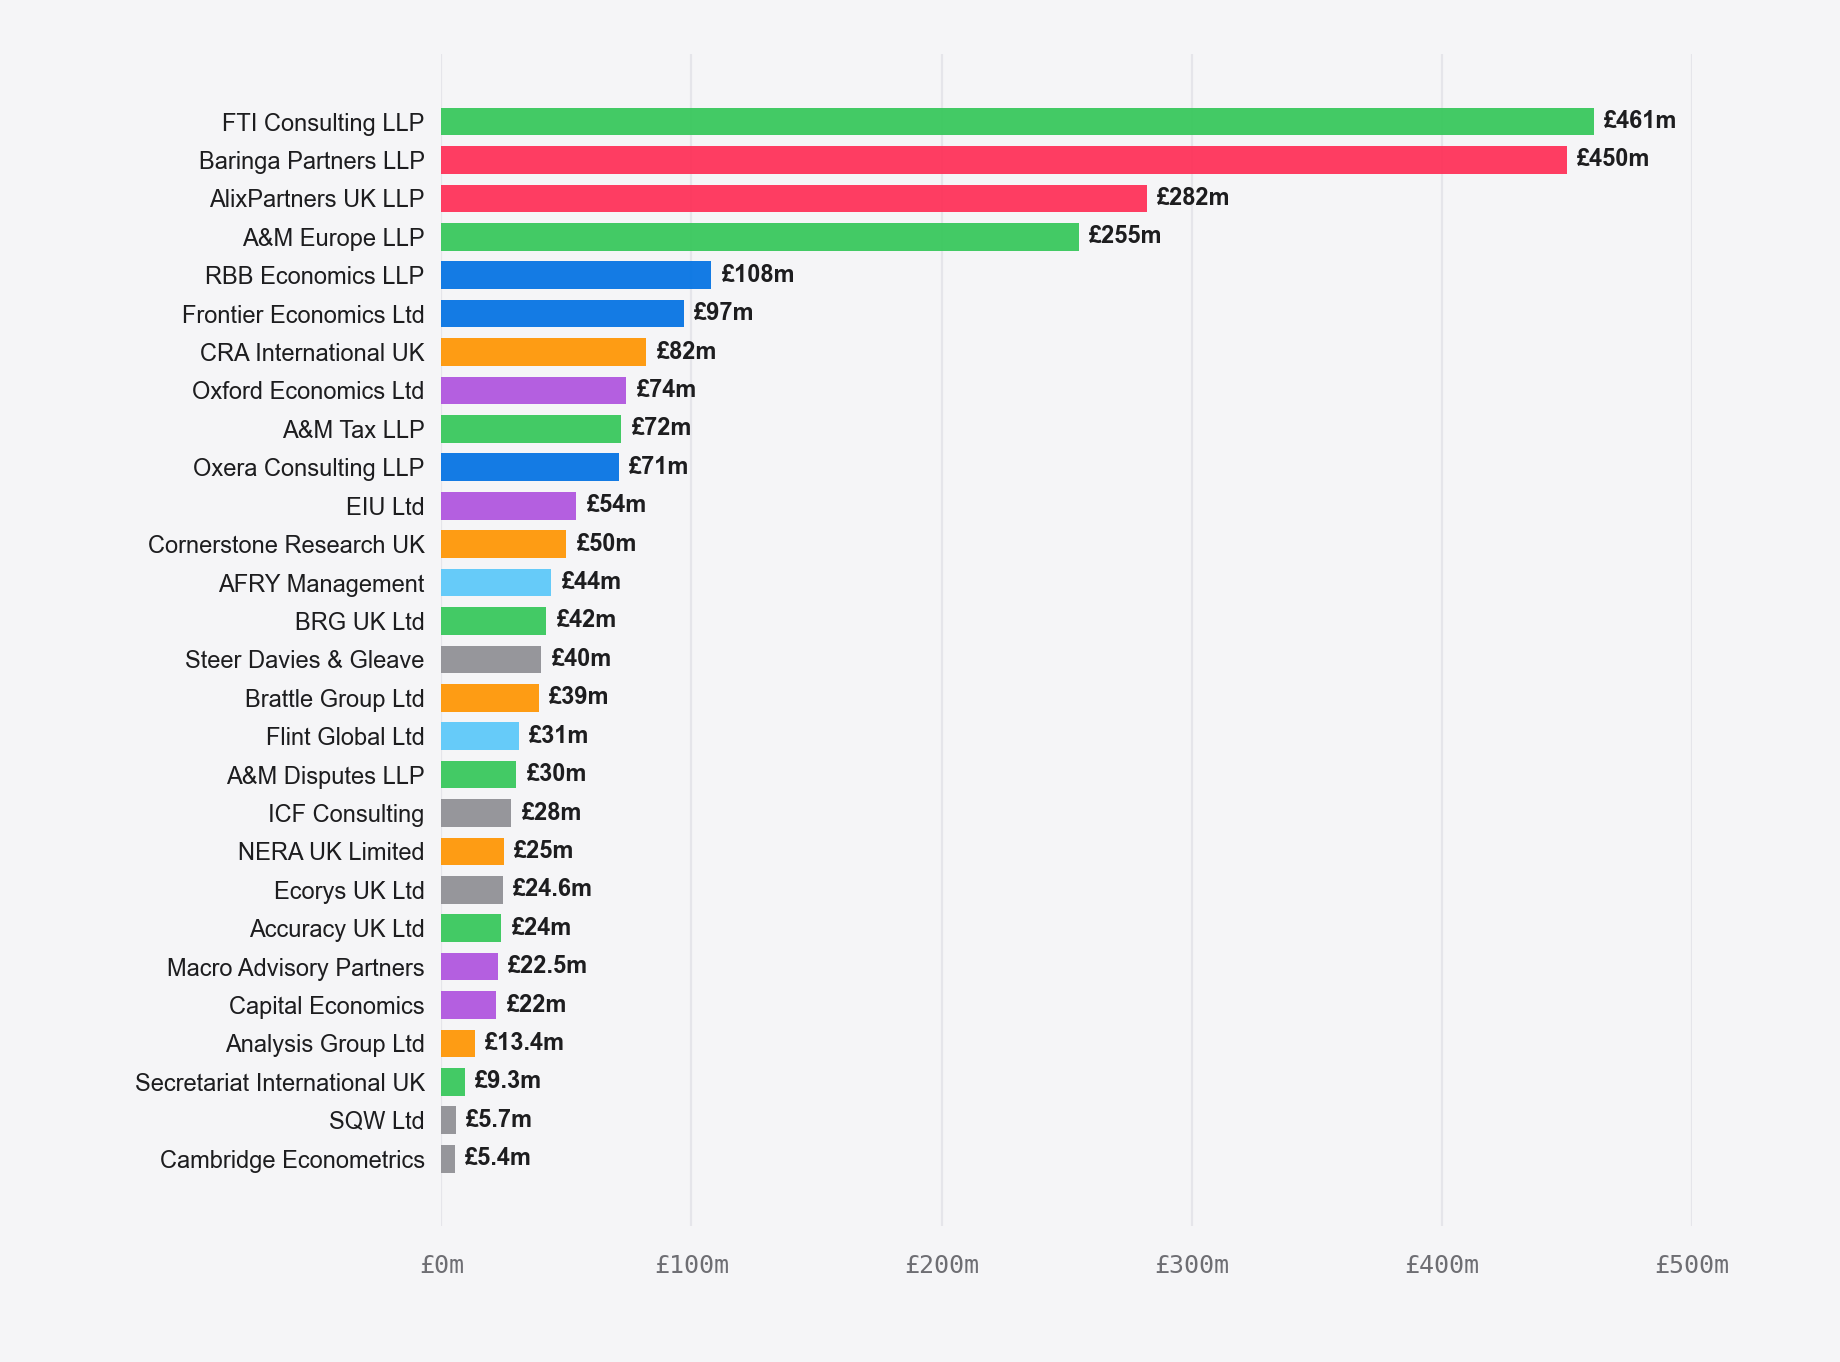
The Companies House-tracked database has positive latest-turnover figures for 30 firms. Exclude estimate-only rows and 28 exceed £5m; those 28 make the cleanest single-year ranking. The rest lack a clean current line, use parent or consolidated accounts, or file as small companies, charities or academic bodies that do not reveal practice revenue. Part 5 follows that long tail.
Revenue League Table
£ MILLIONS · LATEST FILED YEAR · SOURCE: COMPANIES HOUSE
BAR CHART
View on a laptop for the interactive chart.
Four giants sit above £250m. FTI Consulting LLP is the largest measured row at £461m for the 12 months to March 2025 (Companies House OC372614). Its £550m comparative covers a 15-month transition from 1 January 2023 to 31 March 2024, so it is not directly comparable year on year. Baringa Partners follows at £450m, AlixPartners UK at £273m in net revenue after client expenses and disbursements, and A&M Europe at €301m (~£255m). All four are multi-practice advisers. Economics sits beside restructuring, forensic accounting or management consulting; the bundle supplies the scale.
The pure-play tier begins with RBB Economics at £108m, followed by Frontier at £97m, CRA at £82m, Oxford Economics at £74m and Oxera at £71m.
A middle tier runs from roughly £22m to £44m. It mixes US-parented firms, European subsidiaries, transport and policy specialists and macro shops: AFRY, BRG, Steer, Brattle, Flint Global, A&M Disputes, ICF, NERA, Cornerstone, Ecorys, Macro Advisory and Capital Economics.
Cornerstone Research files in dollars. Its FY2025 turnover of $49.7m becomes £38.8m at the project’s fixed £0.78/$ rate, displayed as about £39m. Below it come Accuracy, Analysis Group, Secretariat, SQW, Cambridge Econometrics and a few smaller or older rows. Firms outside the ranking lack a comparable revenue line in their public filings.
CHAPTER 03
The margin spectrum
From loss-making to highly profitable. The same industry contains both extremes.
Operating Margin vs Revenue
SCATTER · BUBBLE SIZE = OPERATING PROFIT
SCATTER PLOT
View on a laptop for the interactive chart.
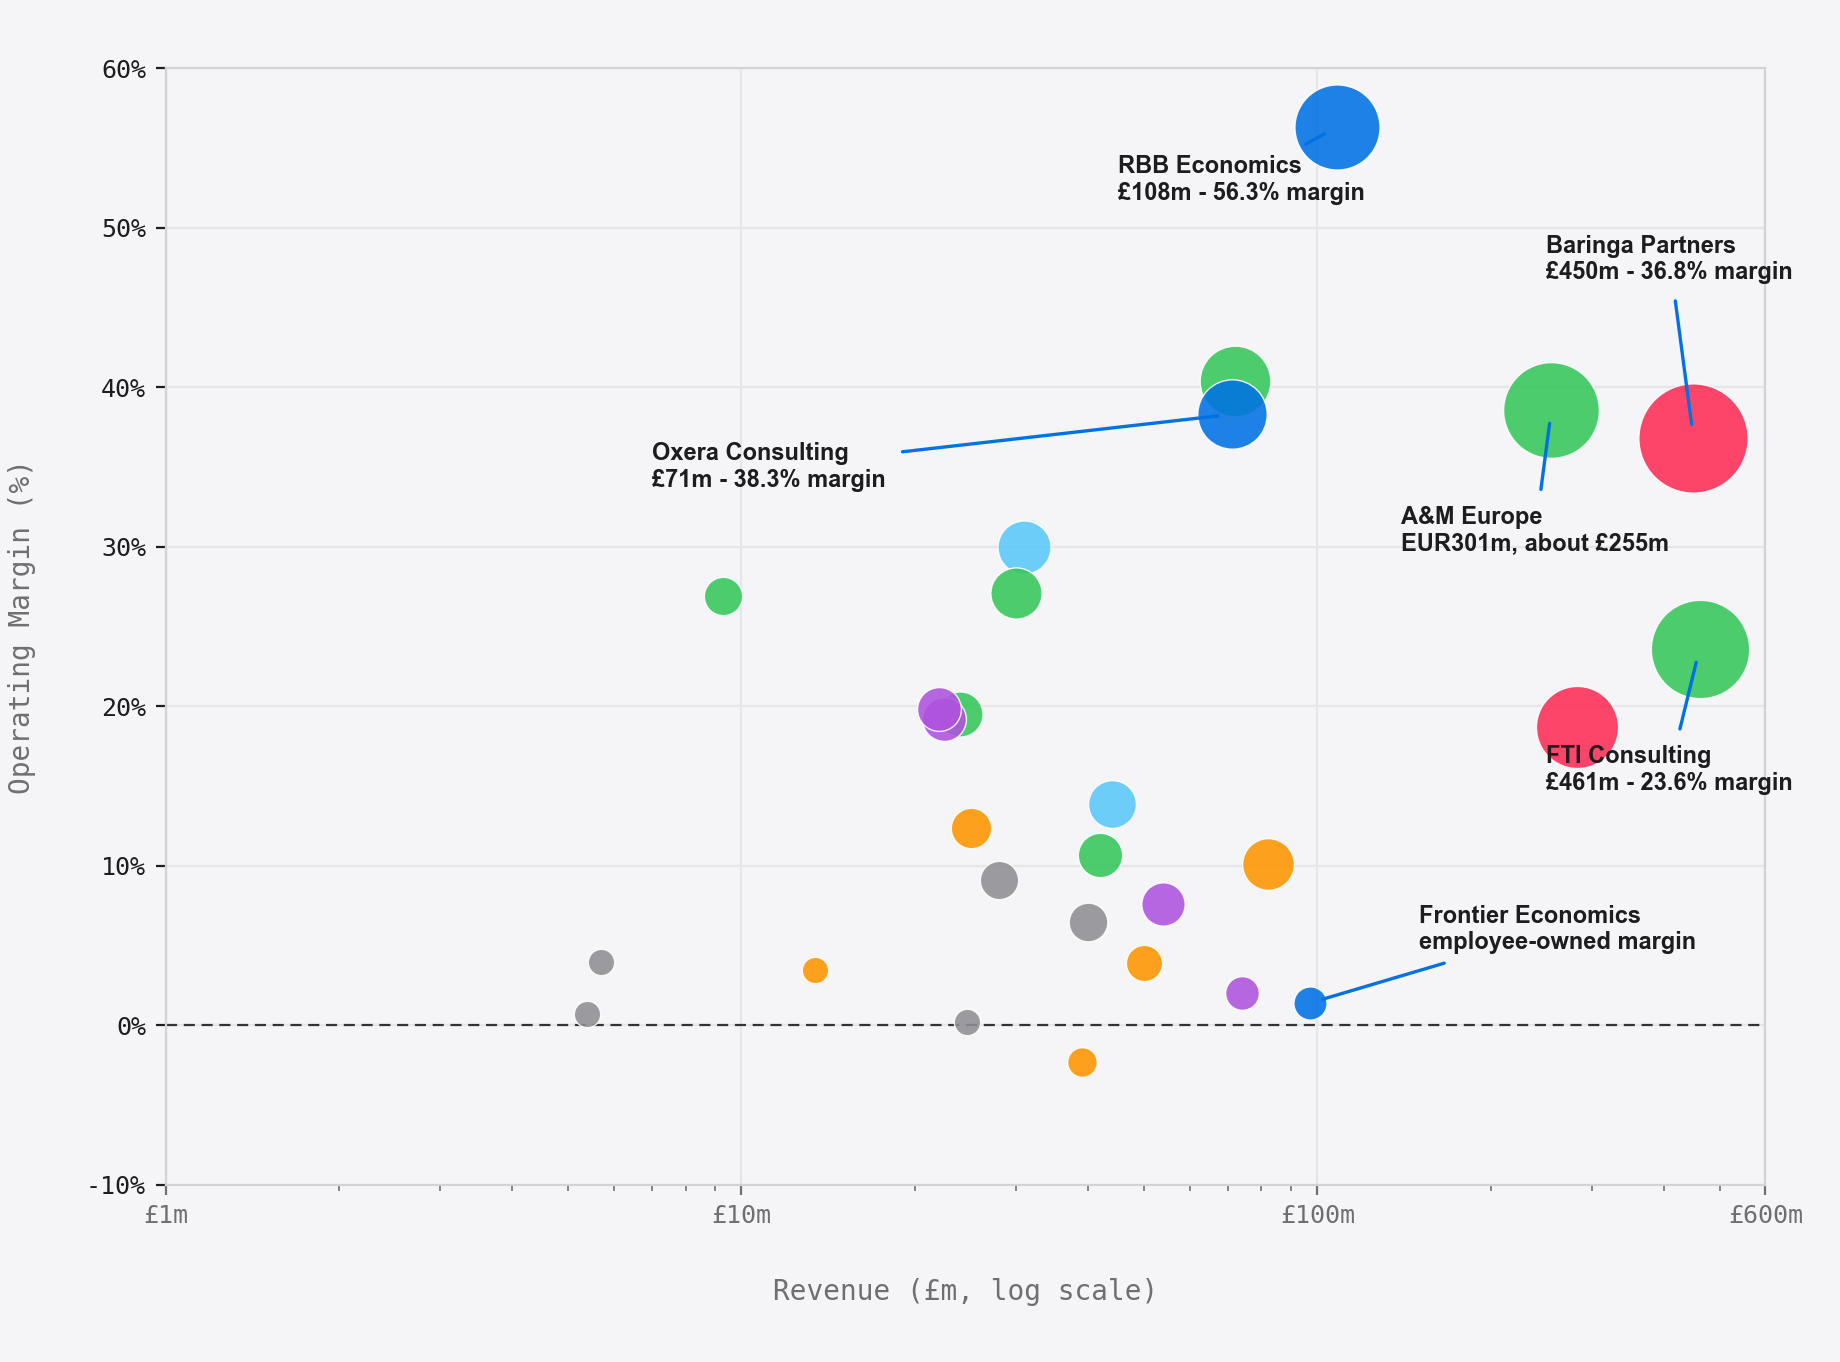
RBB sits alone in the top-right corner. Its operating margin is 56 per cent on turnover of £108m. Firms with similar margins are much smaller; firms with similar revenue have margins roughly half as wide.
Oxera, Baringa, A&M Europe, A&M Tax and Flint Global occupy the 30 to 40 per cent band. They combine substantial revenue with margins capable of rewarding partners handsomely.
Simetrica-Jacobs and Accuracy sit at the bottom of the disclosed-margin rows. Simetrica-Jacobs is at a negative 11.7 per cent margin, Accuracy at negative 3.1 per cent, and Brattle at negative 2.3 per cent. The lowest positive margins are Cambridge Econometrics at 0.7 per cent, Frontier at 1.4 per cent and Oxford Economics at 2 per cent.
Frontier’s thin operating margin may reflect distribution rather than weak economics. The firm is employee-owned, and its accounts are consistent with surplus flowing through salaries instead of residual profit. The three loss-making rows are Simetrica-Jacobs, Accuracy and Brattle, with operating losses of £0.1m, £0.6m and £0.9m respectively. Every other plotted firm that discloses an operating result reported a profit.
A caveat on comparison. The chart uses the margins in each firm’s accounts. For the LLPs in the set (RBB, Oxera, Baringa, FTI, A&M, AlixPartners UK), the project treats operating profit as the line before members’ remuneration. RBB’s 56.3% and Oxera’s 38.3% are therefore on the same operating-profit basis. Their treatment below that line differs: RBB records £0, Baringa £0 and Oxera £8.3m as members’ remuneration. Distributable profit divided by turnover gives RBB 55.6%, Baringa 36.0% and Oxera 26.5%; the first two are almost unchanged because neither charges remuneration below the line. On this basis the RBB–Oxera gap widens from 18 to roughly 29 points. The Ltd companies (Frontier, Oxford Economics, Capital Economics, Brattle UK) report margins after owner remuneration, a different measure. The chart shows where each firm routes value.
CHAPTER 03B
The long view
Revenue since each firm was born. Frontier 1999. Baringa 2000. CRA's UK entity 2000. RBB 2002.
Revenue since founding
£ MILLIONS · ANNUAL TURNOVER · 1999 → 2025
HISTORICAL LINE
View on a laptop for the interactive chart.
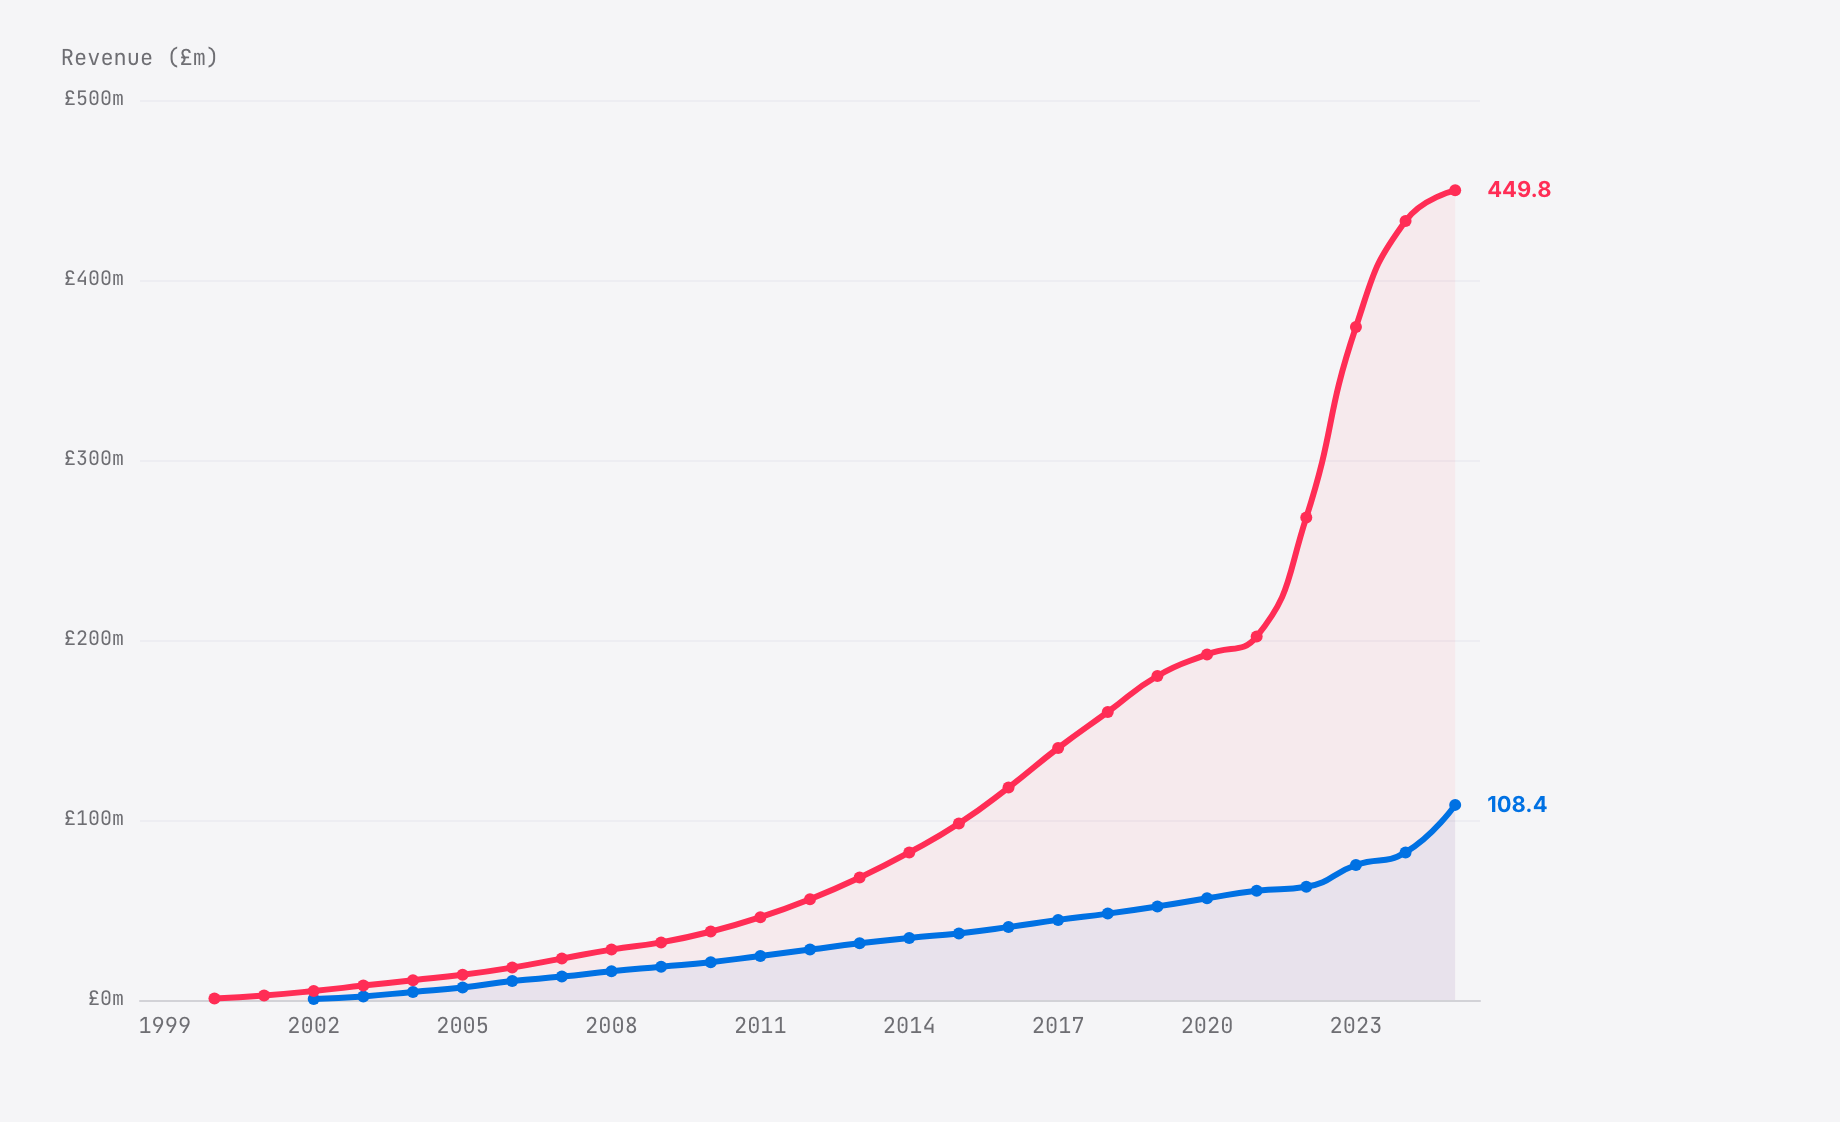
RBB’s early line is illustrative, not a filed-account series.The firm says Derek Ridyard, Simon Bishop and Simon Baker established it in 2002 with 16 people. The chart starts with illustrative points of £2m in 2003 and £21m in 2010. Filed accounts take over in FY2020 at £59m and reach £108m by FY25.
Baringa started smaller and grew faster. A general management consultancy from day one, it crossed £100m in the mid-2010s and £200m in 2021; it now approaches £500m. Average membership rose from 98 in FY2021 to 180 by FY2024, then 178 in FY2025. Over FY2021 to FY2025, filed turnover climbed from £201.9m to £449.8m and average staff from 881 to 1,820, while members rose from 98 to 178.
The combination is consistent with broad organic growth, though filings cannot establish its cause or geography. Nor should it be confused with the FY2022 profit spike, which included a one-off £74.4m gain from the sale of climate-modelling software. The filed accounts reveal two different business models, not a common template.
Frontier is the oldest of the three and the quietest.Companies House records its incorporation on 15 April 1999. The founder file puts Simon Gaysford and Daniel Elliott, both former London Economics directors, in the launch cohort. Officer filings add Philip Burns in September 1999, Michael Webb in January 2000 and Zoltan Biro by April 2000. Over 26 years, the filed series reaches £97m. Frontier describes itself as employee-owned throughout: staff and partners share equity and profit is what remains after salaries. On the chart its line is strikingly straight.
Early figures for RBB, Baringa and Frontier are approximations reconciled with their published histories. Companies House filings supply the recent points: RBB from FY2020, Baringa and Frontier from FY2021 onwards. CRA (UK) is different. Its line uses filed turnover throughout, from £7.5m in FY2002 to £82.4m in FY2024 (FY2025 is not yet filed), making it one of the project’s longest fully filed series.
CHAPTER 04
Two ways to grow
RBB and Baringa, side by side, 2021 to 2025. And then the arithmetic underneath.
Revenue Growth: RBB vs Baringa
£ MILLIONS · FY2021 → FY2025 · £/PARTNER OVERLAID
View on a laptop for the interactive chart.
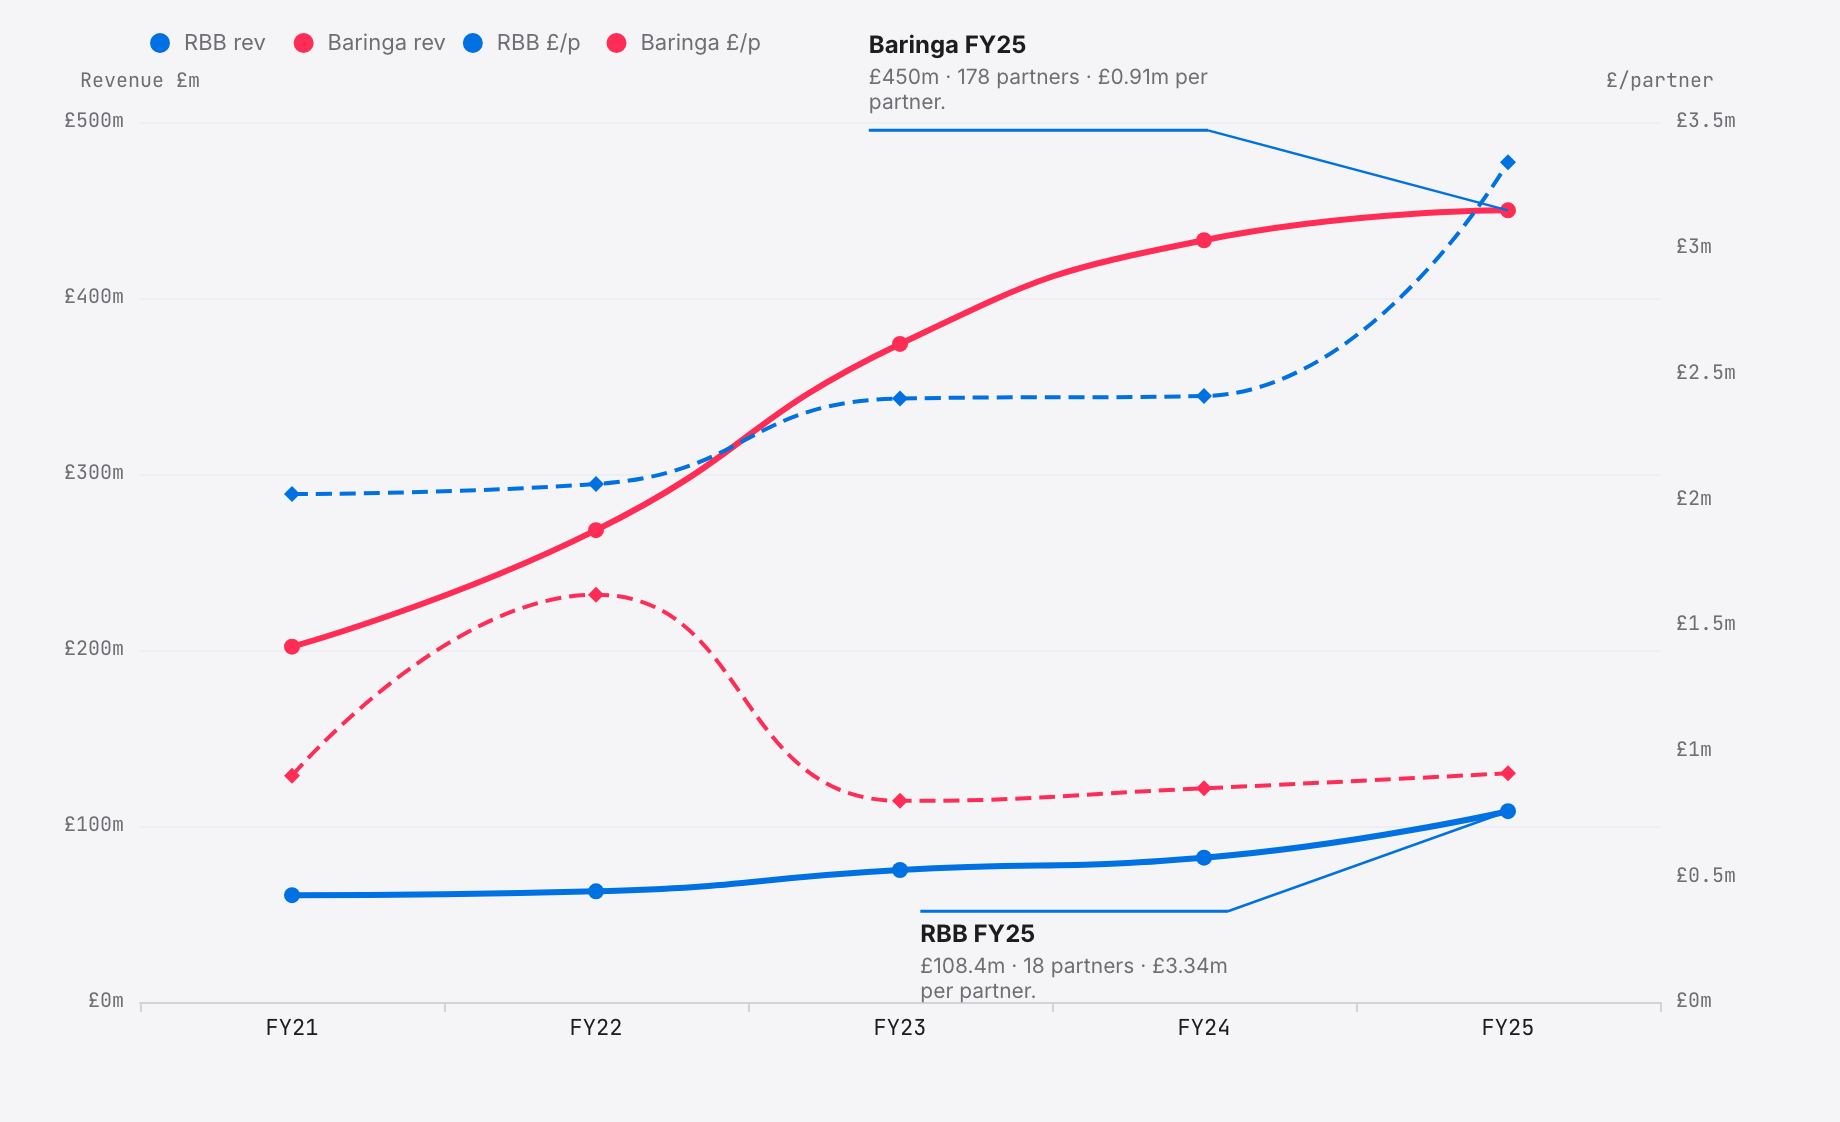
Both are partner-owned London LLPs, both disclose FY2021-to-FY2025 figures and both grew quickly. The resemblance ends there.
RBB Economics runs a concentrated partnership. The membership actually contracted, from 20 in FY2021 to 18 in FY2025, while revenue climbed from £61m to £108m. Profit per member rose from £2.02m to £3.34m, a 65 per cent increase spread across fewer people. Fewer owners, more each.
Baringa Partners is the mirror image. Membership expanded from 98 to 178 as revenue rose from £202m to £450m. The firm also pays roughly £170m in salaries to 1,800 non-partner staff. More owners share a larger pool.
Revenue split: staff · other costs · profit to members
% OF REVENUE · TOP 10 FIRMS · FY24–25 · SOURCE: FILED ACCOUNTS
COST STRUCTURE
View on a laptop for the interactive chart.
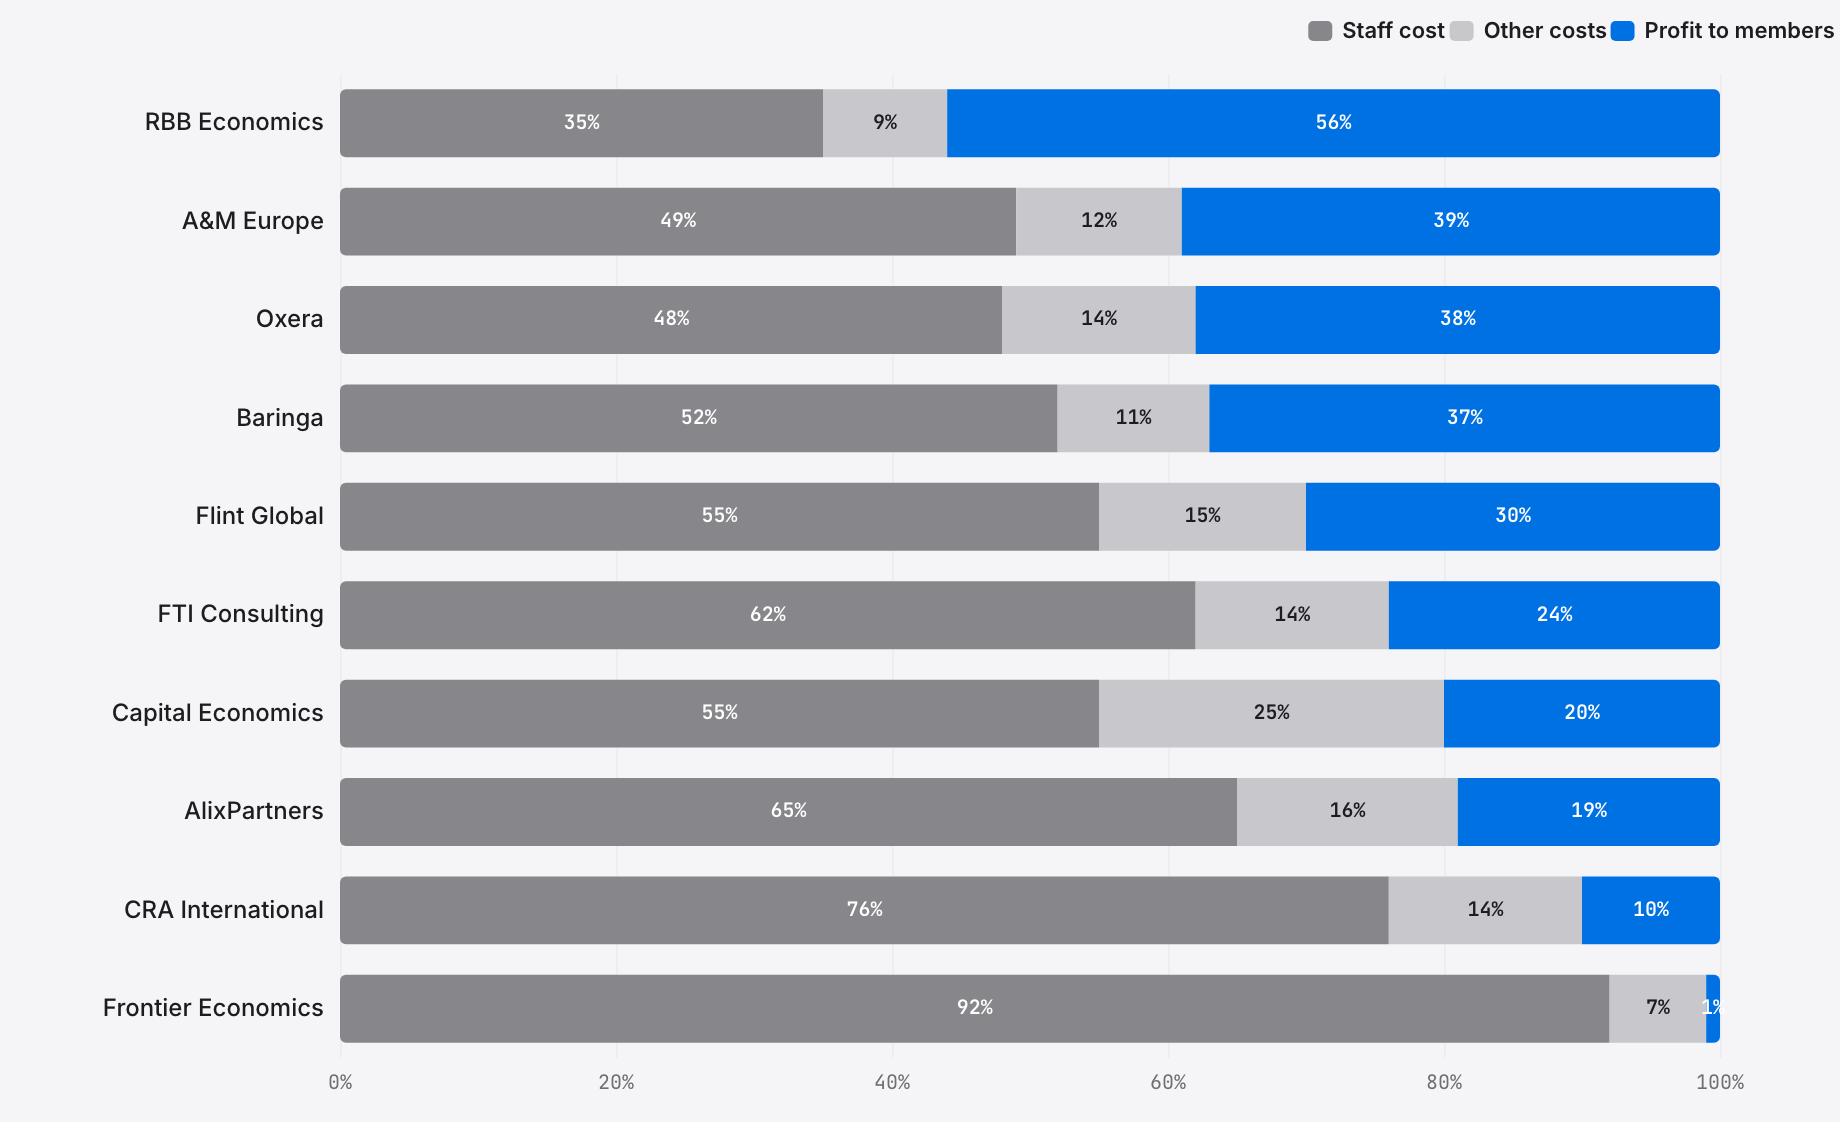
Growth is only the first layer. The next chart divides the same filed revenue among staff costs, other costs and members’ profit.
RBB is the extreme. Of each revenue pound, 56 pence becomes profit for its 18 LLP members, 35 pence pays staff and nine pence covers rent, software, travel, professional indemnity and everything else. Hence £3.34m a year for one partner. A small, closed partnership captures a large share of a medium-sized revenue base.
Frontier reverses the picture. Staff costs absorb 92 per cent of revenue; profit to members is one per cent. Frontier calls itself employee-owned. Its accounts are consistent with value flowing through salaries and staff ownership rather than large residual distributions. Profit is the residue by design.
THE DISPUTES MIDDLE
FTI Consulting, AlixPartners and A&M Europe devote between 49 and 65 per cent of revenue to staff and 19 to 39 per cent to members’ profit. These are large partnerships with deep staffing pyramids: highly profitable, but far from RBB’s extreme.
CRA International sits at the bottom with a ten per cent operating margin. That need not mean inefficiency. The UK company is a subsidiary and sends much of its revenue to its Boston parent, a cost that a domestic LLP such as RBB does not bear.
CHAPTER 05
When the money arrived
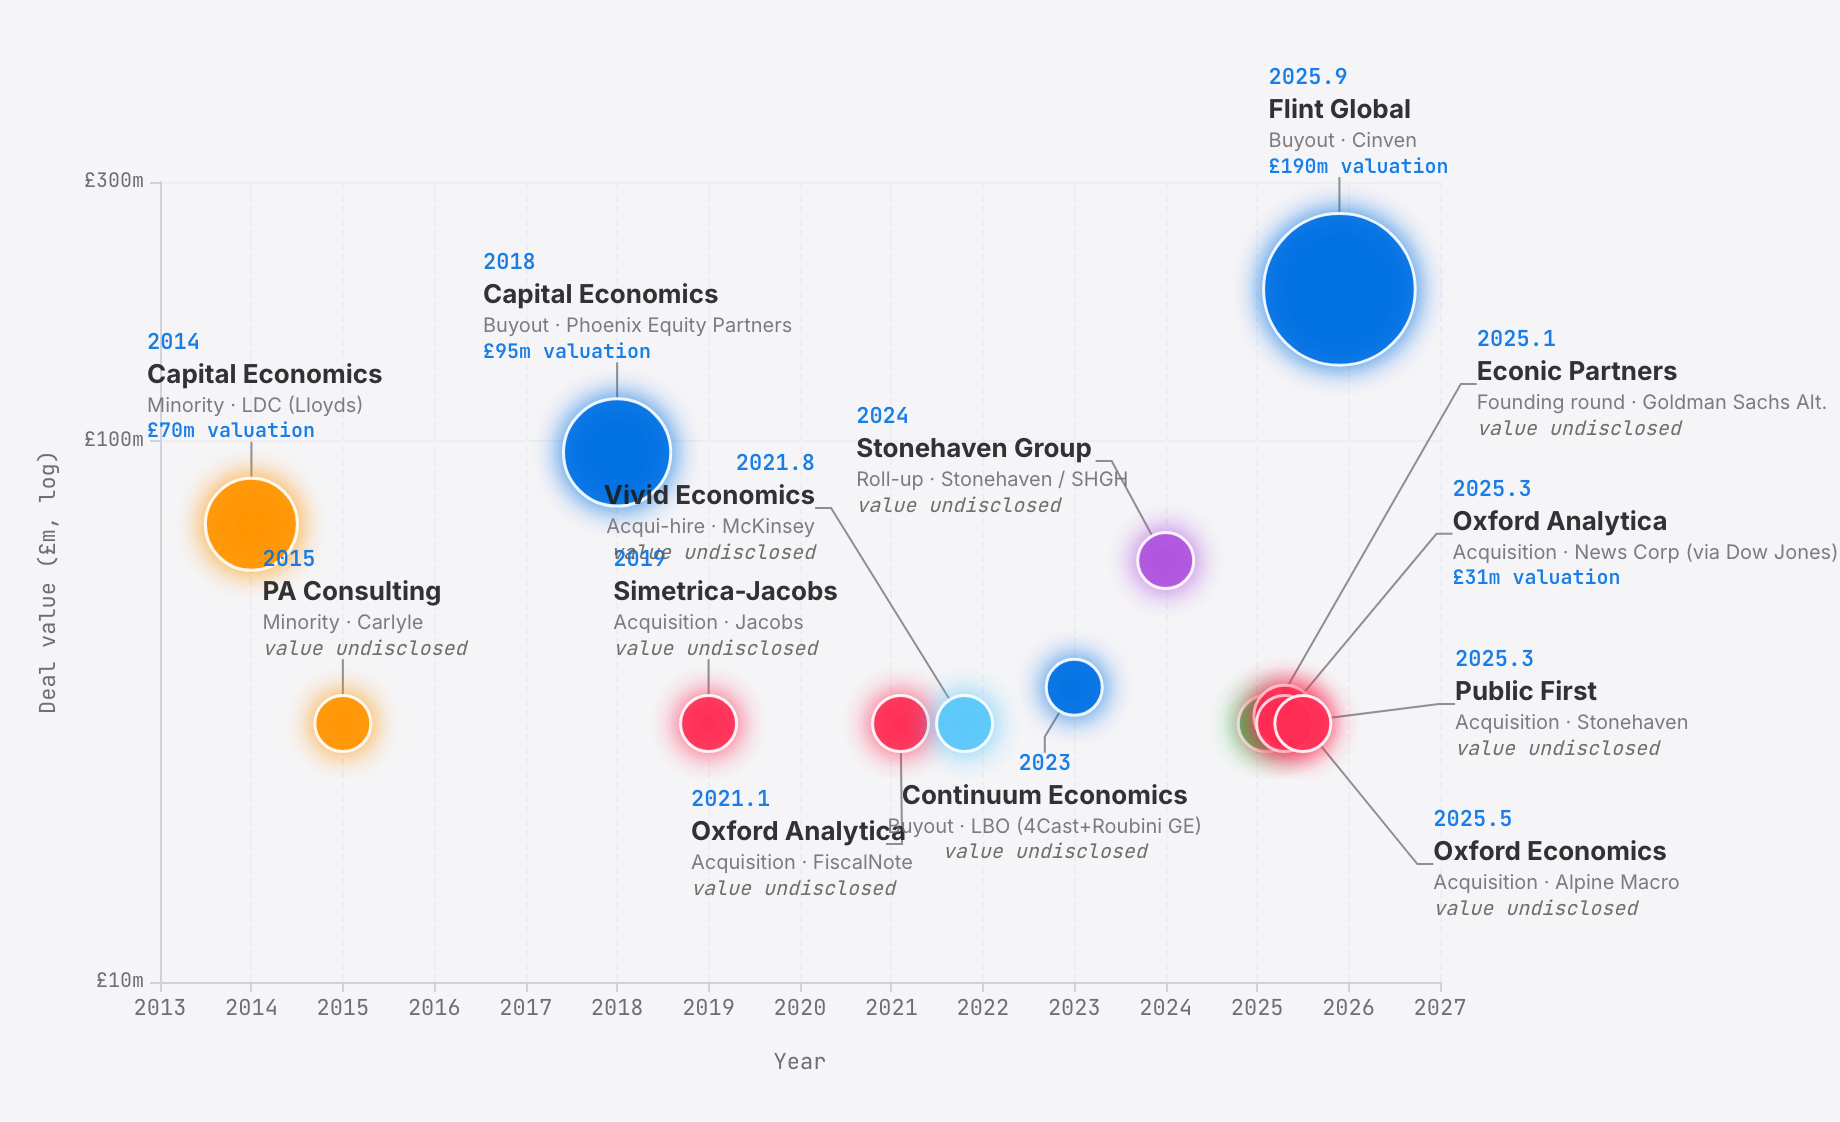
The first private-equity marker in this project file is 2014. More followed.
In December 2025 Cinven agreed a majority investment in Flint Global. The official terms were private; press reports put the valuation at ~£190m, or ~16x EV/EBITDA. The chart labels this as reported, not filed. Ed Richards, a former Ofcom chief, and Sir Simon Fraser, a former Foreign Office permanent secretary, remain shareholders.
The deal file also records Stonehaven’s March 2025 acquisition of Public First, following an earlier 2024 roll-up marker. Capital keeps arriving. Precise public valuations are scarcer than deal announcements.
CHAPTER 06
The debt map
50 outstanding charges across the industry. Here is who banks whom.
Outstanding Secured Charges
LENDERS → FIRMS · COMPANIES HOUSE CHARGES REGISTER
SANKEY DIAGRAM
View on a laptop for the interactive chart.
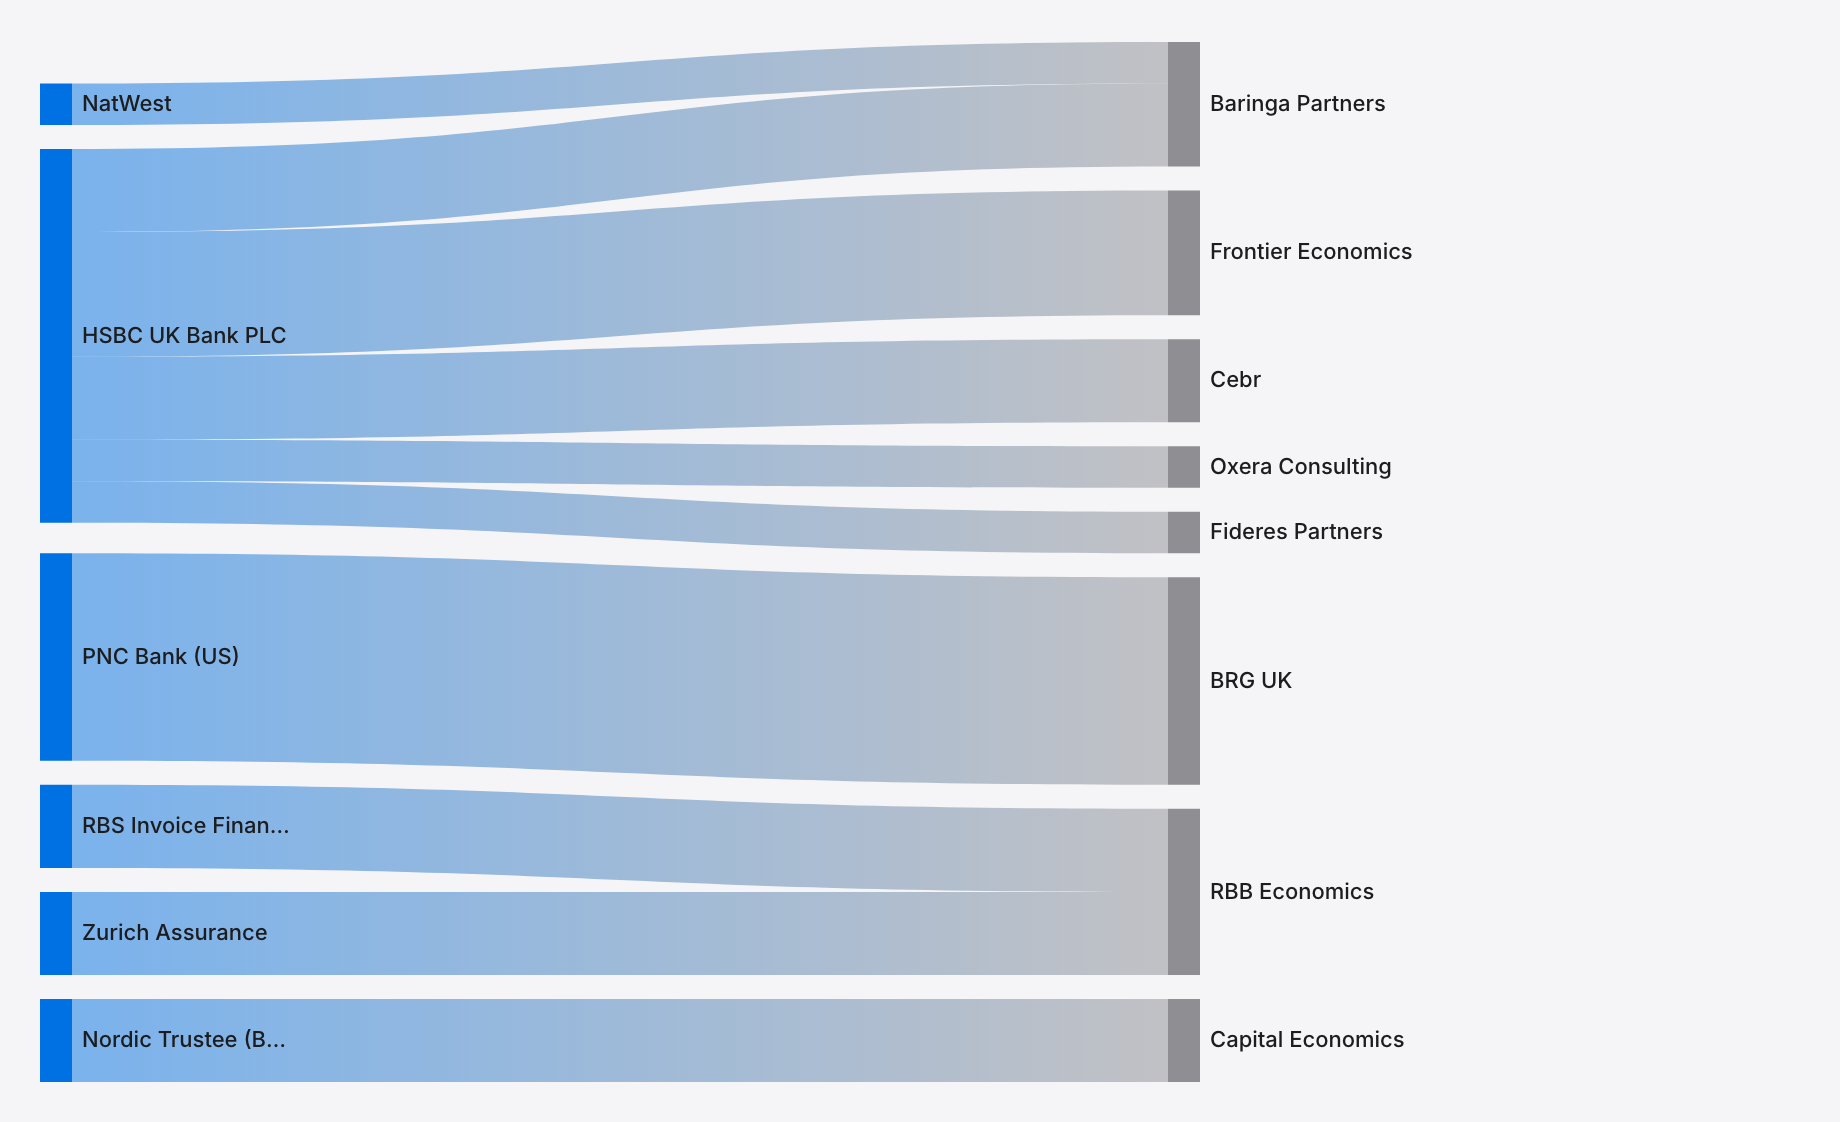
HSBC UK Bank PLC is the most visible common lender. It holds charges against Baringa Partners, Frontier Economics, Oxera Consulting, Cebr and Fideres Partners: five otherwise different economics and advisory firms.
BRG UK uses America’s PNC Bank. Its parent arranged the facility through US banking relationships; the London subsidiary uses it.
RBB Economics splits its charges between RBS Invoice Finance and Zurich Assurance. The Zurich charge is pension-linked.
Capital Economics is the oddity. Its charges point to Nordic Trustee, which represents bondholders rather than banks. The original Phoenix Equity Partners structure used charges in favour of Glas Trust Corporation Limited, registered between April and June 2018. Those were satisfied in March 2026. New charges favouring Ocorian Trustee (UK) Limited, trading as Nordic Trustee, were registered in November 2024 and January 2025. Whether refinancing, a secondary sale or both, the ownership structure is changing.
CHAPTER 07
The partnership gold rush
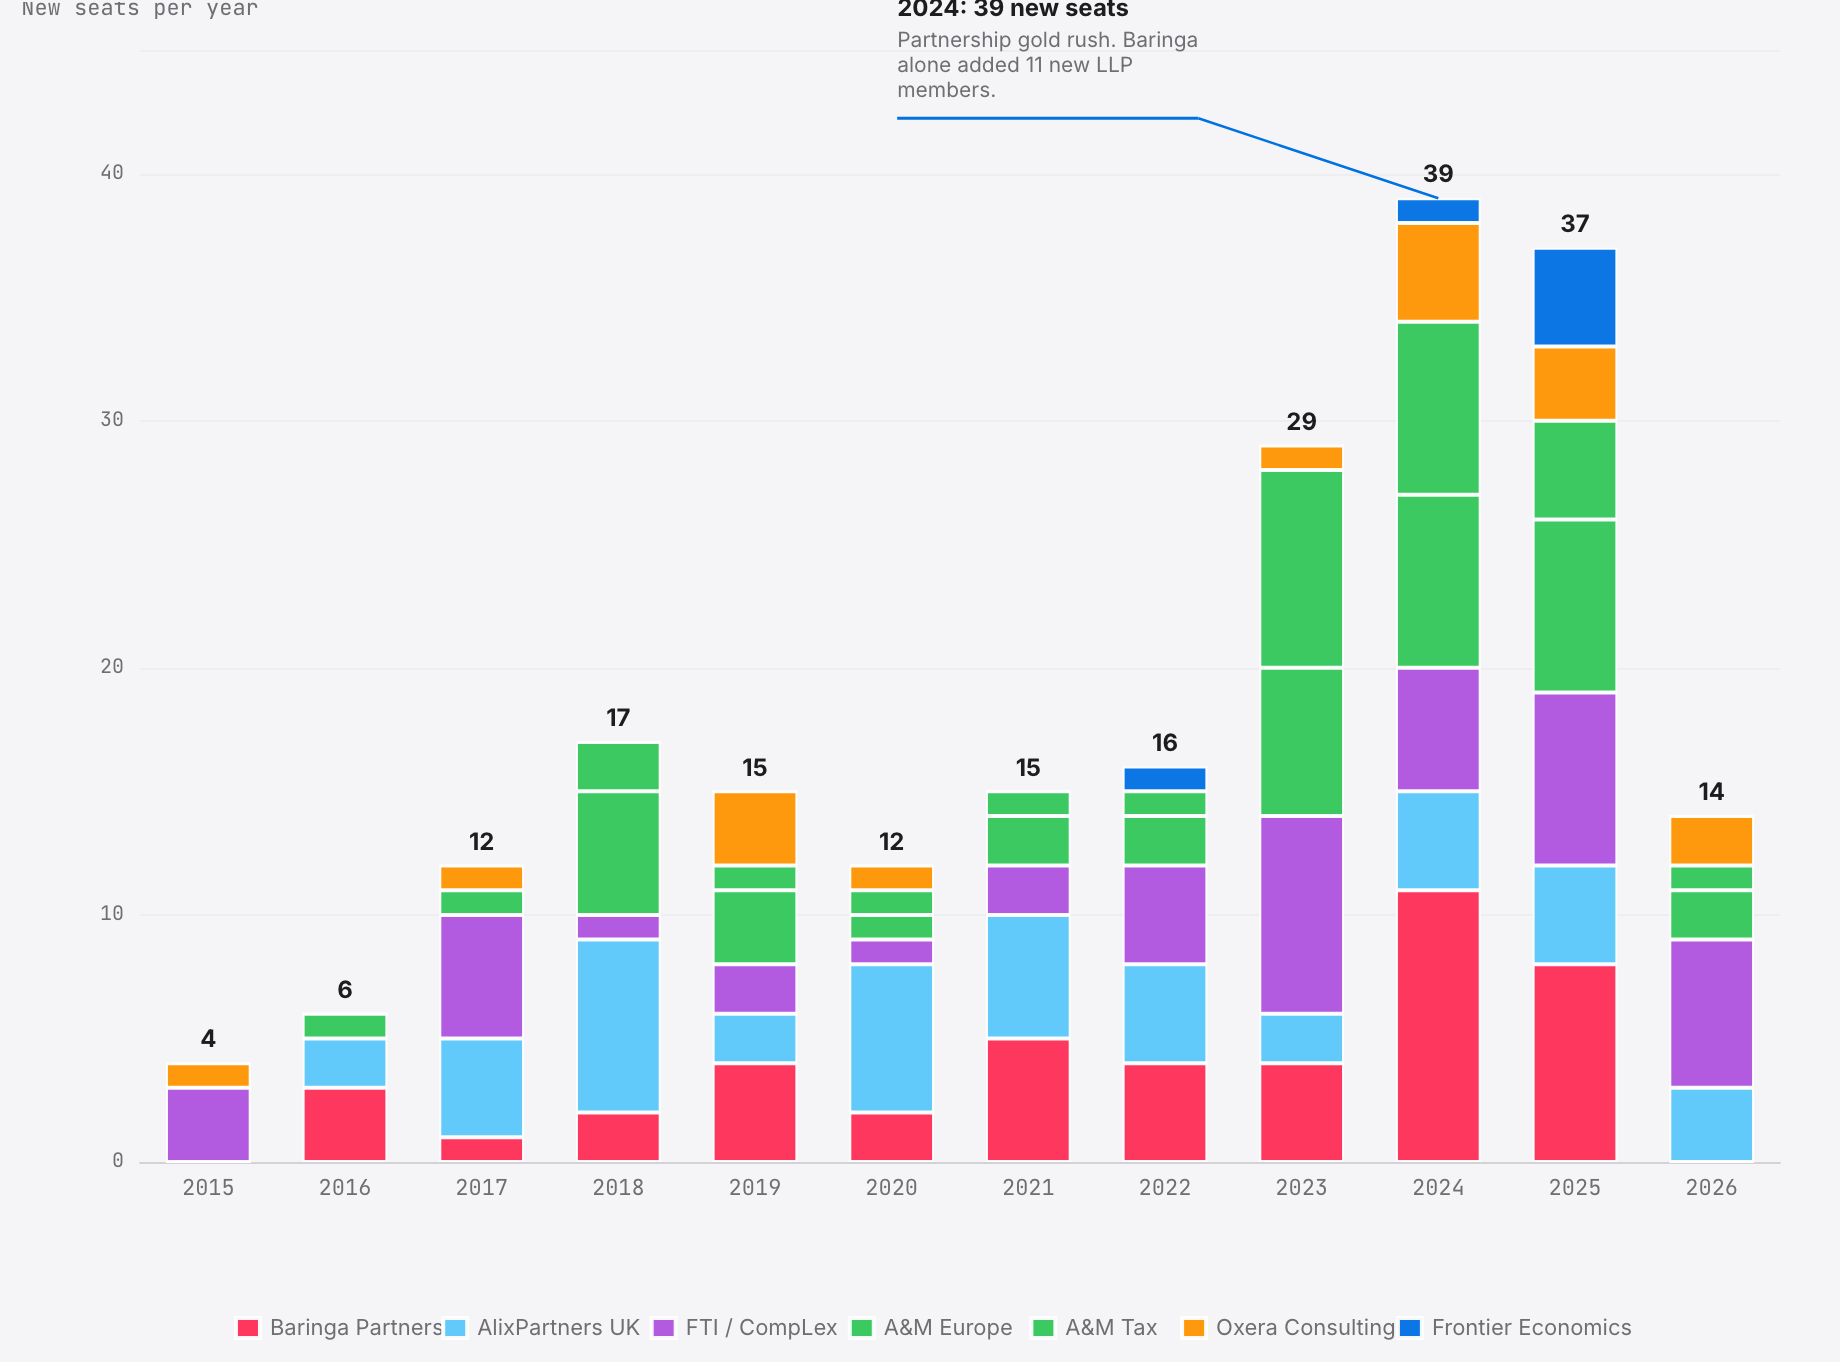
New director and LLP-member appointments per year across seven selected large firms.
Director & LLP Member Appointments, 2015–2026
NEW SEATS PER YEAR · SOURCE: CH OFFICER APPOINTMENTS FILINGS
STACKED BAR
View on a laptop for the interactive chart.
The break comes in 2024. During 2015 through to 2022, the seven selected economics and disputes firms filed roughly 15 new director or LLP-member appointments a year. The chart jumps to 39 in 2024 and 37 in 2025. In 30 months the plotted rate more than doubled.
Baringa led the chart, and A&M ran second. Baringa's bars show 11 new LLP members in 2024 and another eight in 2025, the largest single-firm contribution in this seven-firm appointment chart.
INFLOWS ARE NOT THE WHOLE STORY
The partnerships are churning as well as growing. Recorded departures rise after 2022. Subtract them from appointments and the seven firms gained between five and 15 partners in most years. In the charted series, the net figure passed 20 in 2024.
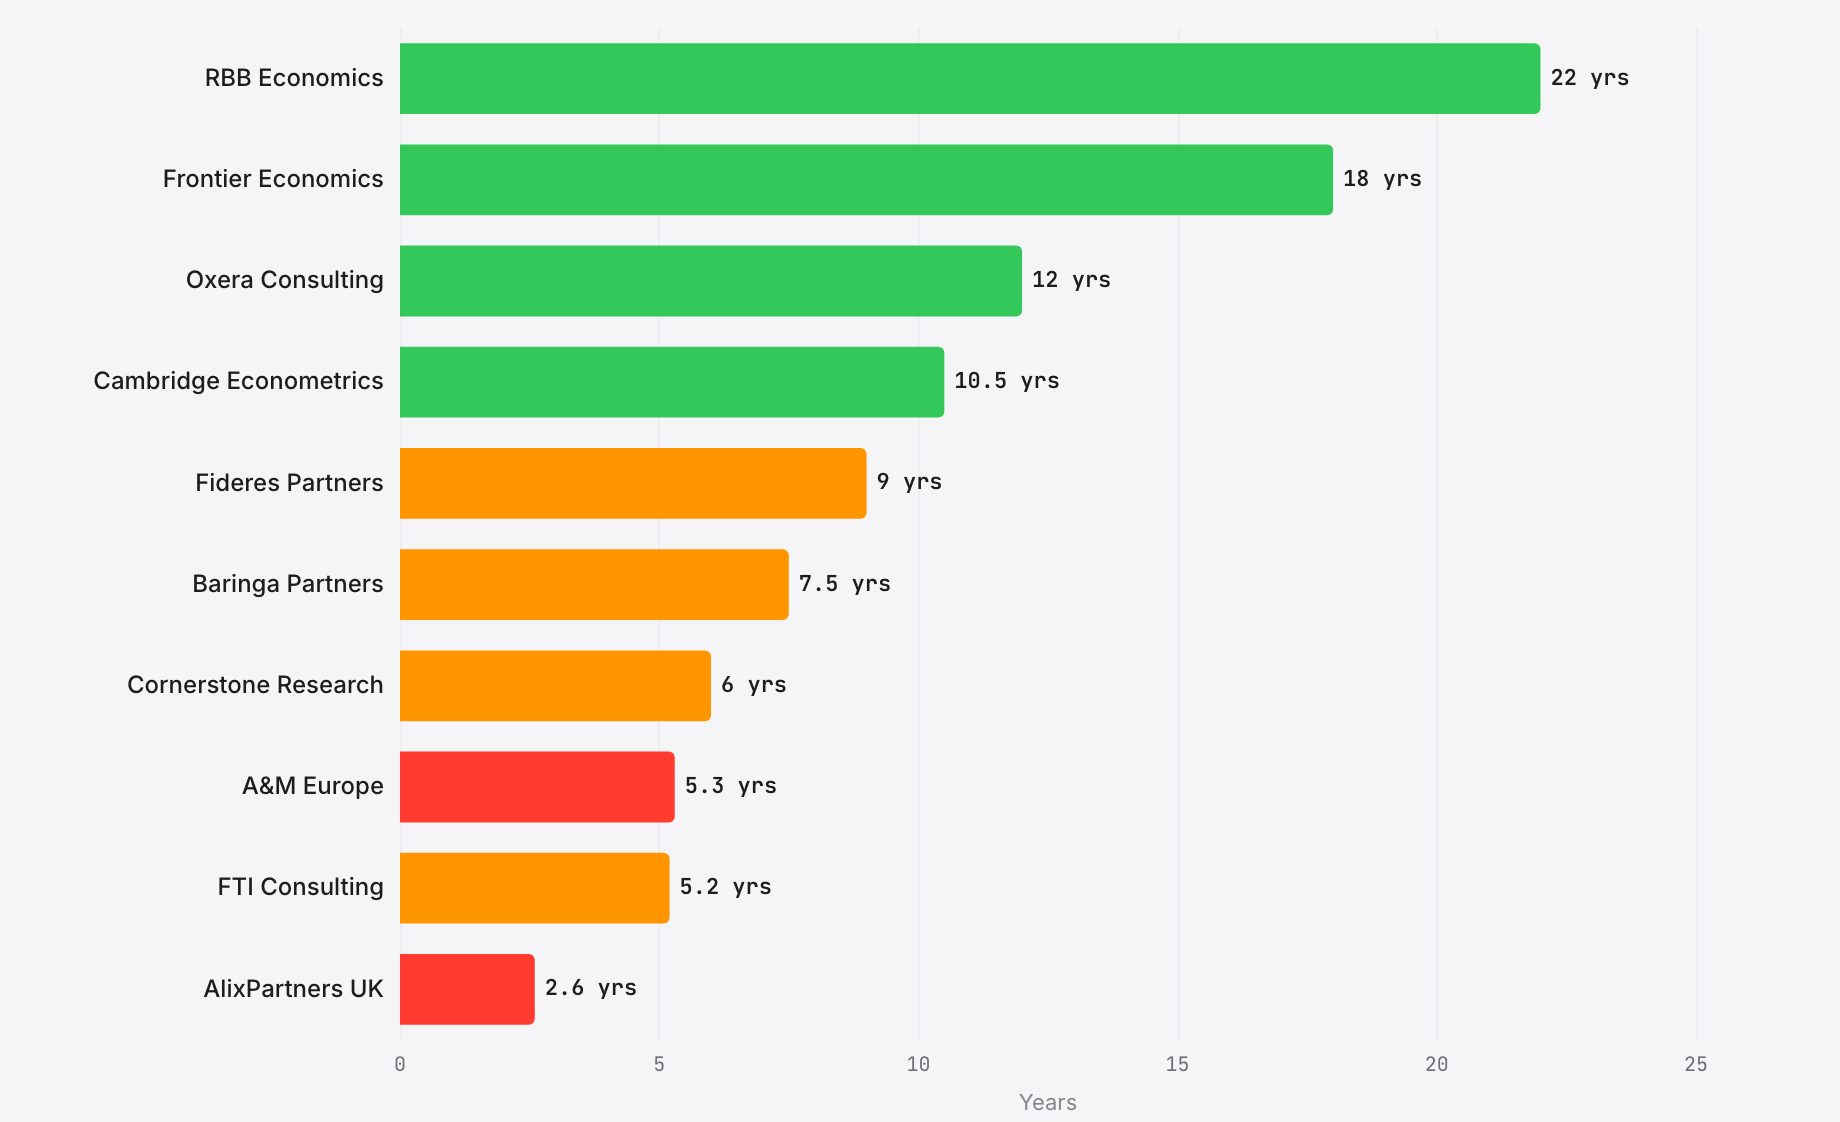
Average LLP-member tenure, by firm
YEARS · ACTIVE MEMBERS ONLY · SOURCE: 1,885 CH OFFICER APPOINTMENTS
WHO KEEPS THEIR PEOPLE
View on a laptop for the interactive chart.
The next panel measures retention: the average tenure of LLP members still active at each firm.
RBB and Frontier occupy the long end. Active members average 22 years on RBB’s partnership register and 18 on Frontier’s directors’ register. Both show unusual continuity. One recent exception is Vitaly Pruzhansky, who resigned from RBB on 1 April 2025.
Oxera, Cambridge Econometrics and Fideres sit in the middle tier at 9 to 12 years in this tenure calculation.
THE CONVEYOR-BELT END
AlixPartners UK averages 2.6 years. A&M Europe records 5.3 and FTI, including its Compass Lexecon subsidiary, 5.2. In this dataset, those larger partner groups have shorter active-member tenure than RBB, Frontier, Oxera, Cambridge Econometrics and Fideres.
The gold-rush chart above tells you who is hiring. This one tells you who they are replacing.
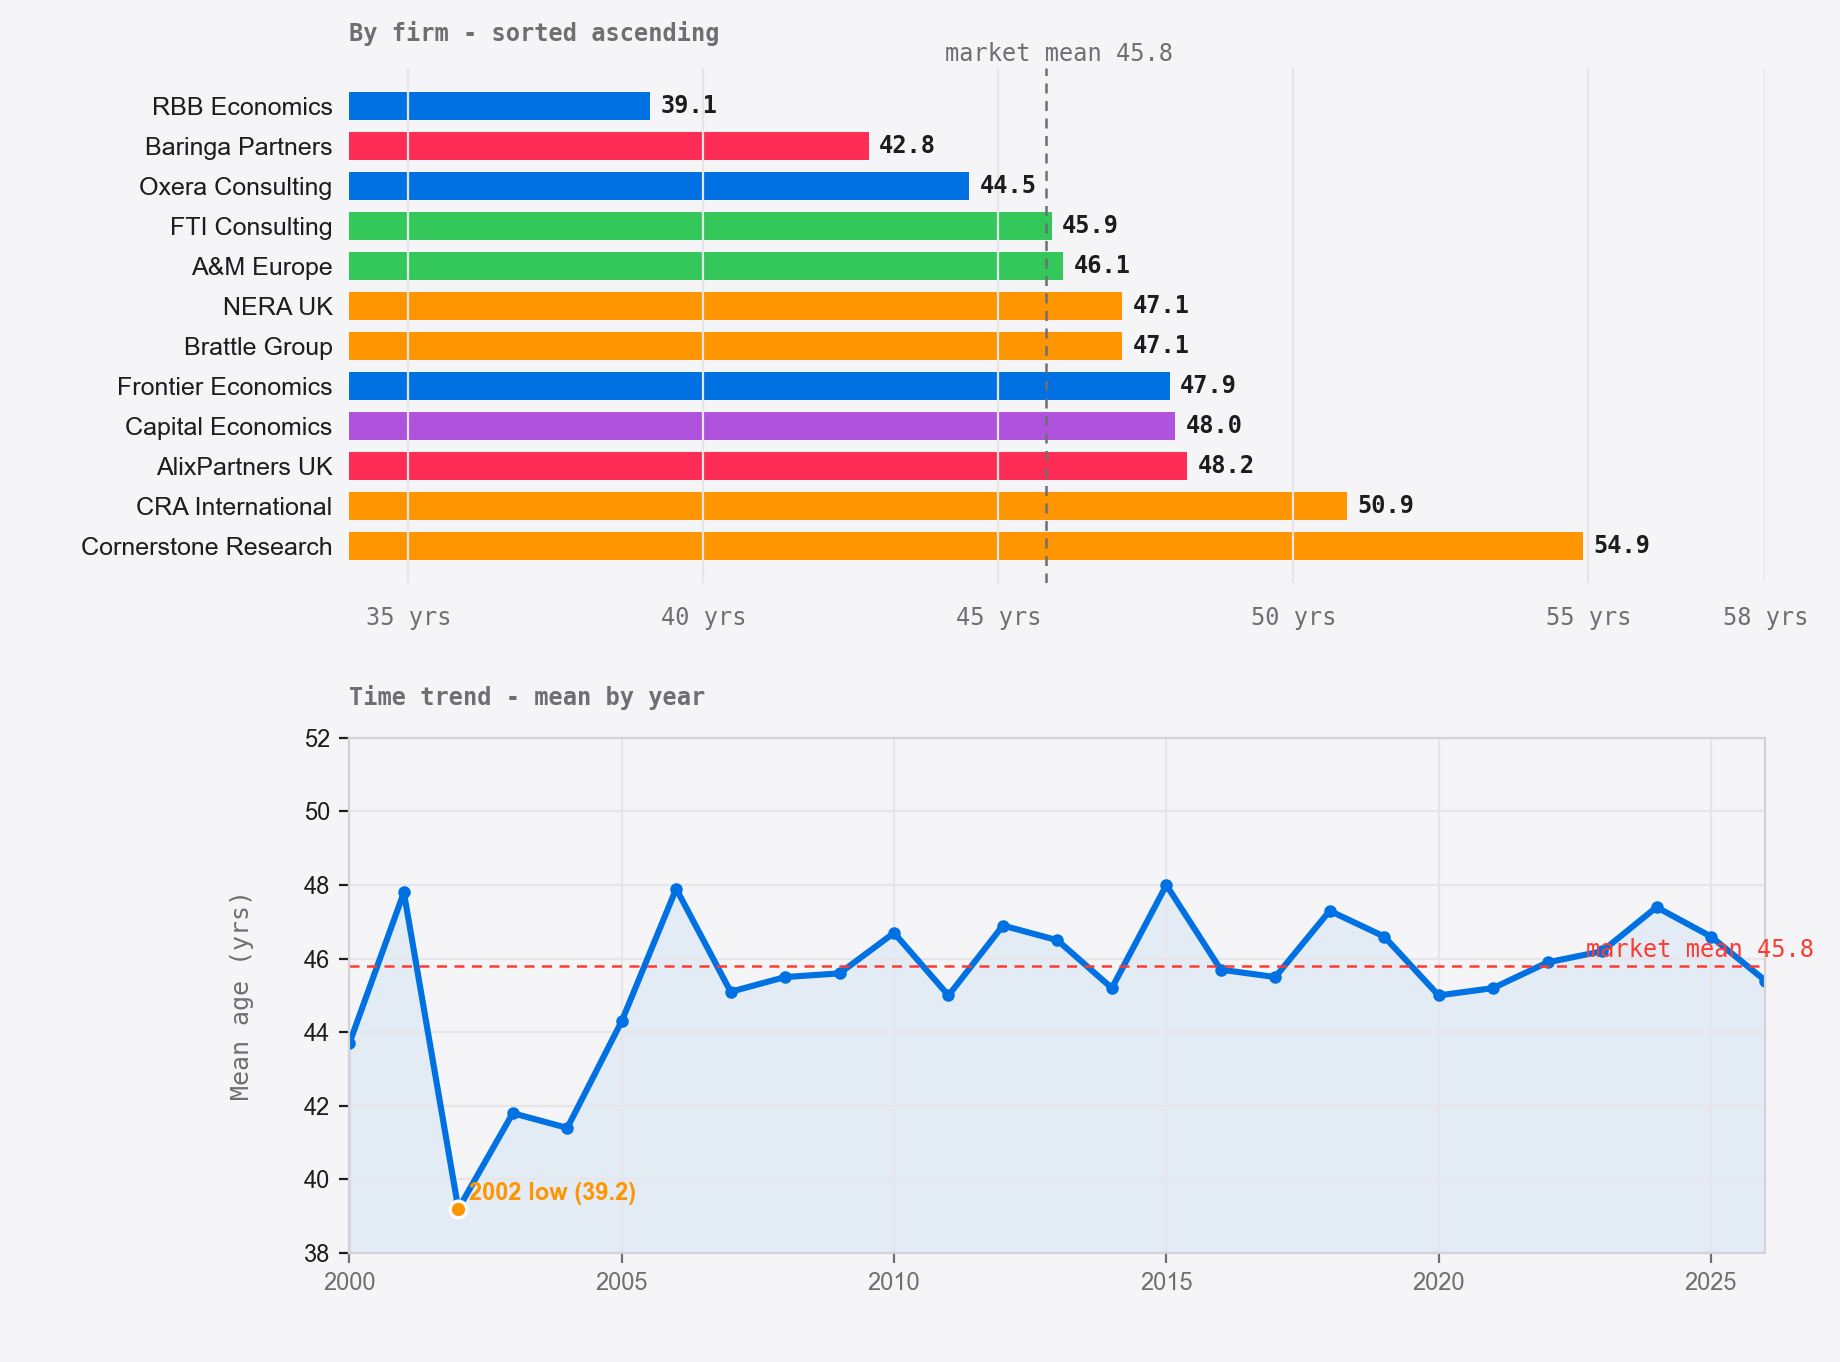
Age at appointment: when do they actually make partner?
MEAN AGE AT APPOINTMENT · 2000–2026 · 1,637 USABLE DATED OFFICER RECORDS
AGE AT APPOINTMENT
View on a laptop for the interactive chart.
Chapter 07 ends with age at appointment.
The time trend is almost flat. Between 2000 and 2026, new directors or LLP members in this officer dataset averaged 45 to 47 years. Neither private equity’s arrival in 2014 nor the appointment surge of 2024 shifts the line much.
Differences between firms are much larger. RBB appoints people at an average age of 39; Cornerstone Research has no appointment below 46. The spread is 16 years among firms selling into the same regulatory proceedings. It looks structural rather than accidental.
The data cannot say what clients reward, but it shows two appointment patterns. RBB grows its own. Its mean of 39 reflects the 2002 founding cohort plus a few later members appointed at a similar career stage. Cornerstone imports senior names. Its register contains former regulators, tenured academics and established experts appointed later in life. The minimum of 46 describes this dataset, not a formal hiring rule.
Both routes can build expert-witness practices, but not the same kind of firm. Promoting younger insiders may concentrate knowledge in a small, durable partnership. Importing senior people may maximise named credibility while shortening officer tenure. Baringa, FTI, A&M and Frontier, in the 43-to-48 range, look more mixed.
TWO PARADOXES
RBB is both the youngest large firm in the chart and the longest-tenured. The chronology points to 2002, when Ridyard, Bishop and Baker left NERA with 13 colleagues: a founding cohort of 16 economists. The officer file then shows unusual continuity.
AlixPartners is the oldest and the shortest-tenured in this chart. Its visible pattern is later-age lateral hiring and shorter officer tenure. Cornerstone Research takes the later-age pattern further: its minimum age at appointment in this dataset is 46.
CHAPTER 08
The founder tree
Selected events in the project chronology, 2000 to 2025.
EDGE WEIGHT = SHARED DIRECTORS / LLP MEMBERS 2000–2025 · FORCE LAYOUT
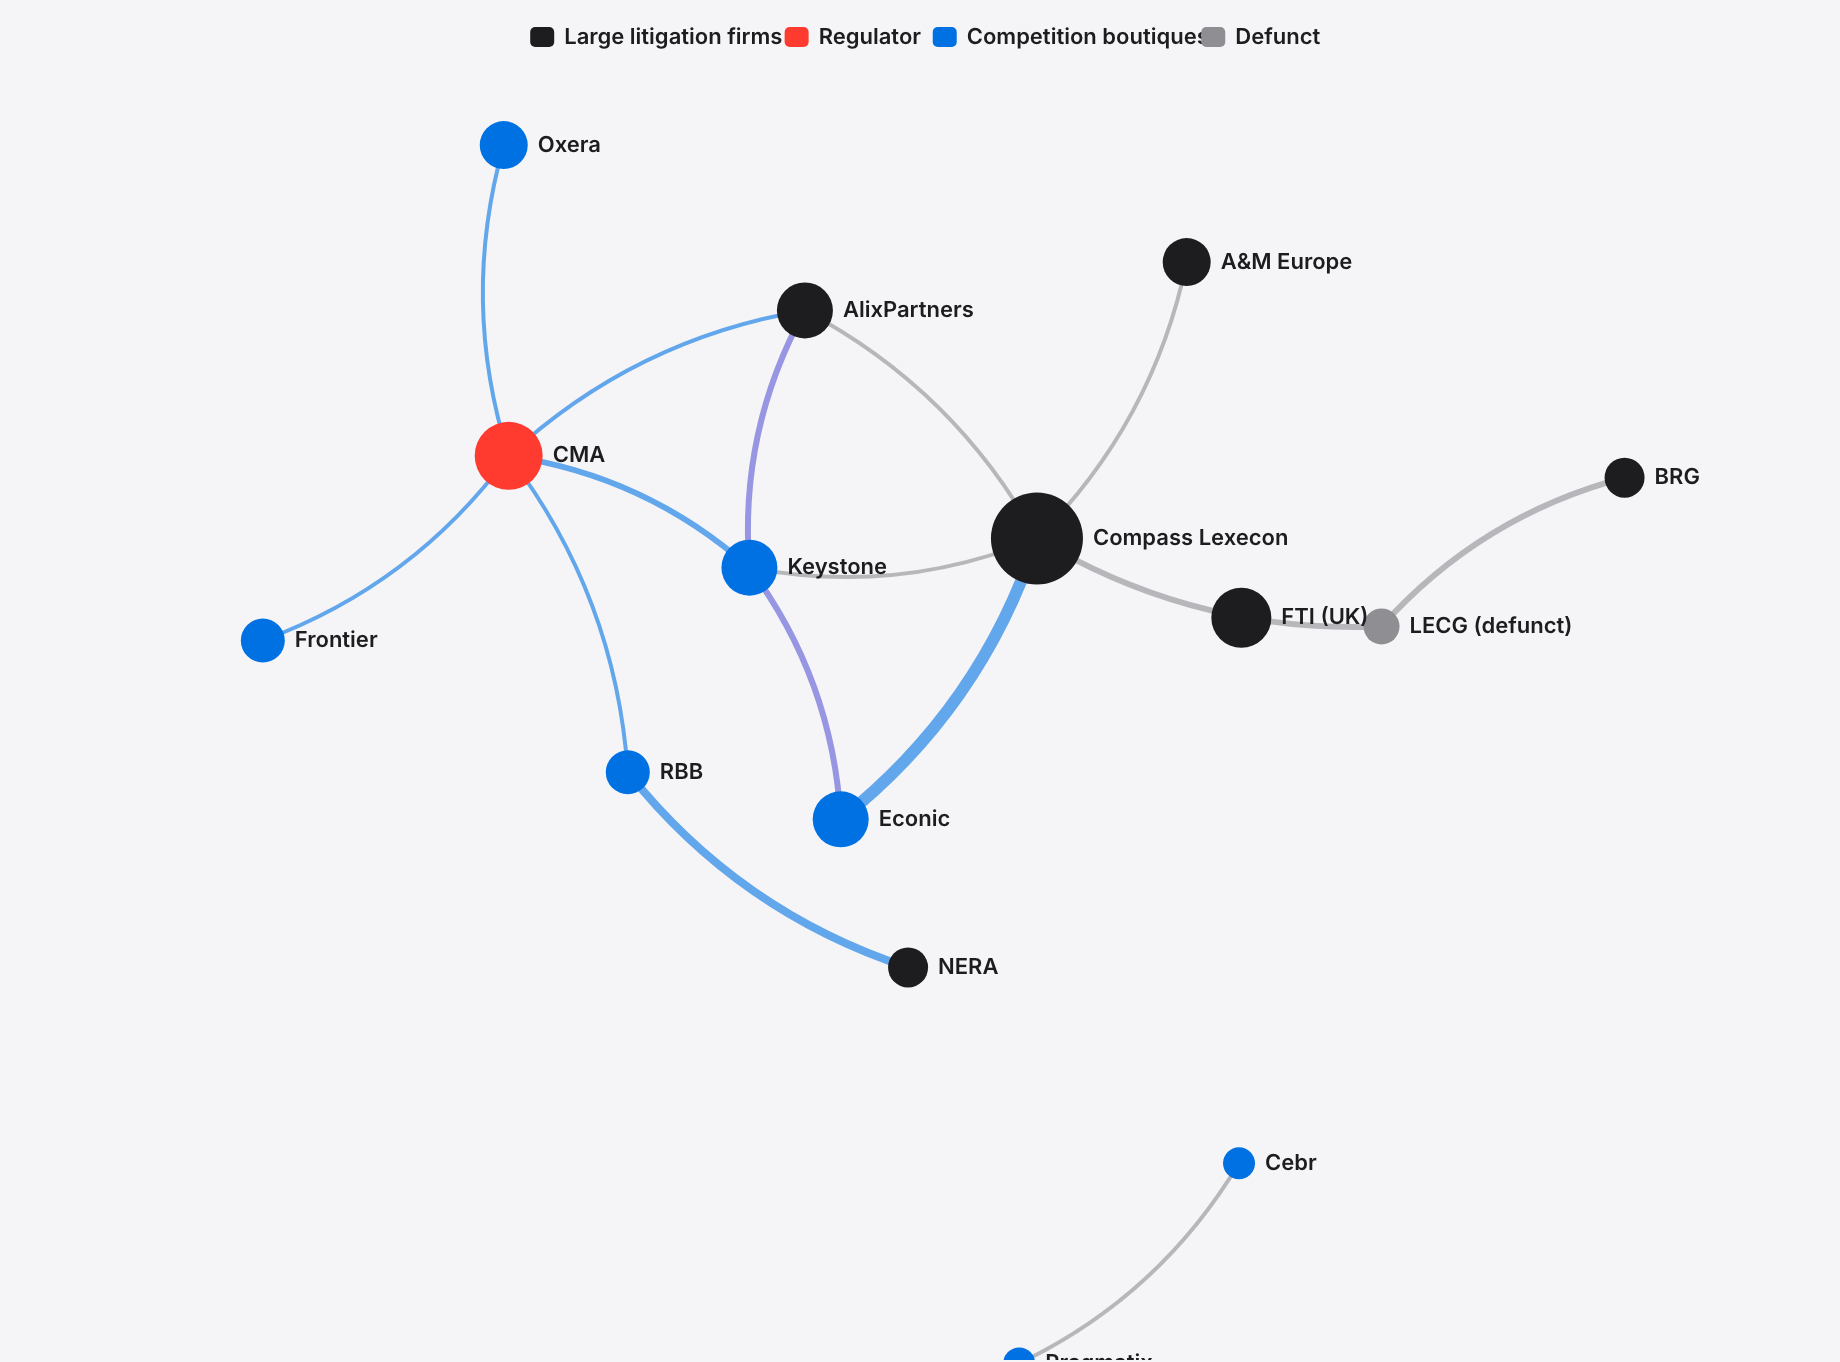
COMPASS LEXECON AS HUB
View on a laptop for the interactive chart.
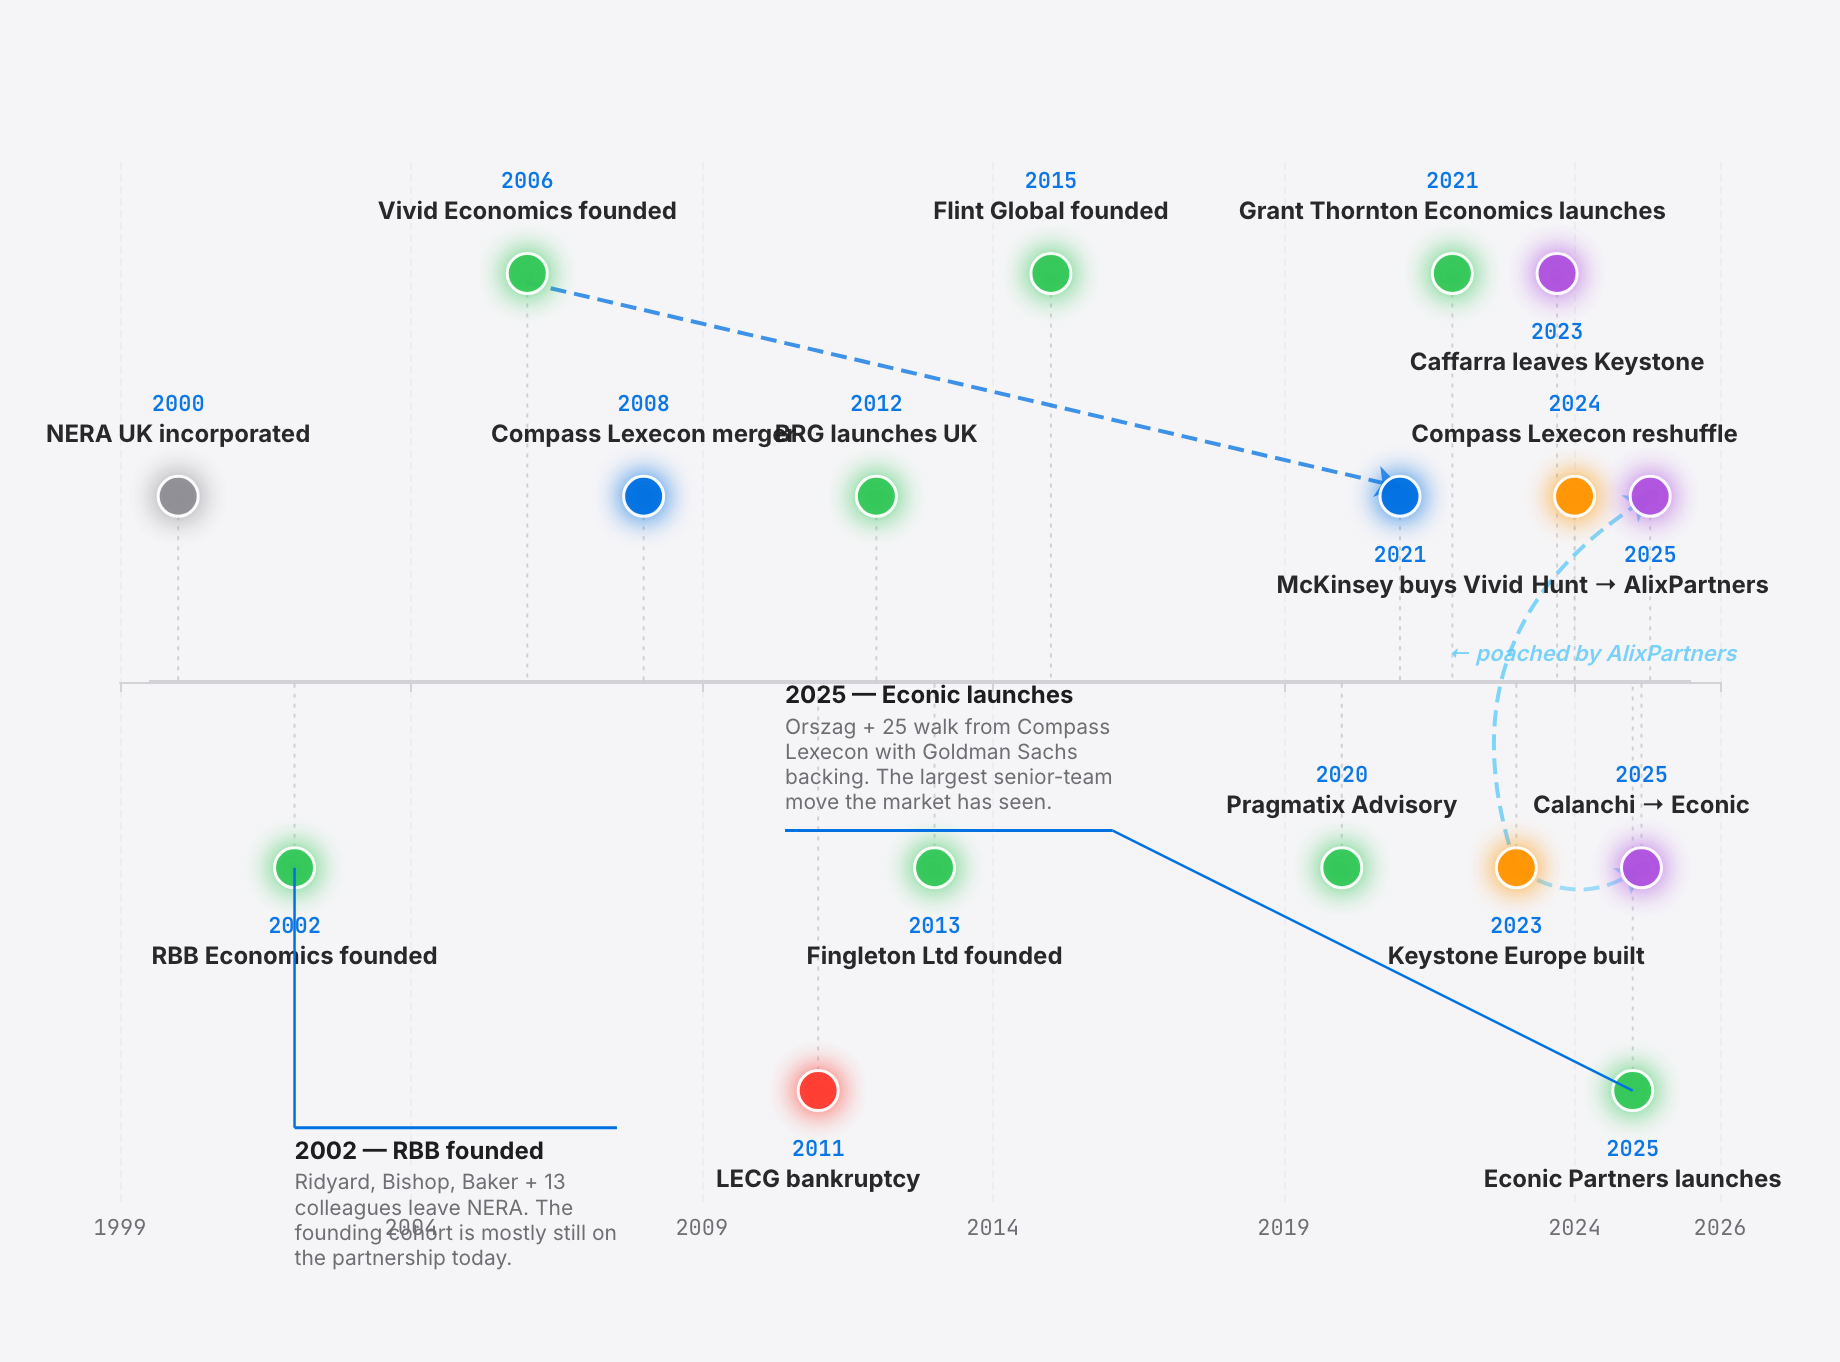
The timeline records events; the network shows what they left behind. An edge joins two firms when the project file finds a shared director or LLP member since 2000.
Compass Lexecon is the hub. Many firms sit within one or two edges. The thickest ribbon runs from Compass Lexecon to Econic Partners and represents the 25-plus economists named in Econic’s February 2025 launch release.
The CMA sits in its own satellite orbit. It has exit edges running everywhere, to Keystone, Oxera, Frontier, AlixPartners, and almost no return edges. The regulator is a net exporter of talent. It is not a marketplace.
THE ISOLATED TWO
Frontier and RBB are almost detached. Frontier has one documented edge in the senior-move file: Mike Walker’s move from the CMA, announced in October 2025 and effective 5 January 2026. RBB’s one edge is Benoît Durand, recruited from the European Commission’s competition side and admitted as an LLP member on 1 April 2011. Both firms have fewer than two overlap edges in this dataset. The tenure chart in chapter 07 shows the same isolation another way.
CHAPTER 09
The competition-economics family tree
First, the microeconomics-and-regulation lineage from 1980. Then the ownership chain linking FTI, LECG and the two Lexecons. Both charts are reconciled with Companies House and the firms’ published histories.
UK economic consultancy: a family tree, 1980–2026
Press play, or drag the slider, to watch the industry grow. Vertical dotted lines mark major regulation; curved arrows show people moving from one firm to start or join another.
1980
UK-grown employee-ownedUS firm in LondonStrategic / regulatorySpecialist
Corporate ownership: how FTI, LECG and the Lexecons fit together
Several firms are subsidiaries or successors of larger groups. FTI merged Chicago’s Lexecon Inc with COMPASS to form Compass Lexecon in 2008. The chart also marks LECG’s 2011 liquidation. David Teece founded Berkeley Research Group the year before; Jorge Padilla’s European competition team joined Compass Lexecon during the wind-down.
Operating todayBrand absorbedLiquidated
Curved arrows show people moving between firms in the first chart and acquisitions or LECG’s dissolution in the second. Founding dates are reconciled with Companies House and each firm’s history. Keystone Strategy is an American firm, founded in 2003 and owned by Accenture since 2020; its bar marks the London competition-economics build from 2022, not a UK founding.
8,293 filing events, 90 firms, one industry
The tracked dataset fits in one SQLite database and runs on a laptop. The laptop costs less than an RBB partner earns in a morning.
90
Firms tracked
£2.4418bn
Selected-entity turnover
8,293
Filing events
1,664
Account filings
Companies House supplies the firm-level financial and registry figures; market comparisons and deal notes are attributed separately. No firm was contacted, no interview conducted and no informant cultivated. The data was already filed, indexed and public in Cardiff. Statutory documents largely reconstruct the project’s £2.44bn selected-entity total. They do not turn it into an estimate of sector revenue.
The catalogue has seven segments: policy contains 35 firms, regulation 17 and macro forecasting 16. Litigation and competition contribute another 15, including several high-revenue firms.
Where turnover is visible, it determines block size. The largest rectangles belong to the multi-practice advisers FTI Consulting, Baringa and A&M. Pure economics boutiques, selling formulas, expert reports and witness evidence, occupy medium-sized blocks in their own colour band.
Firms without a clean current turnover line remain as unsized rows. In the treemap they become equal tiles, ordered by category rather than revenue.
The chart measures what the accounts expose. The rest of the catalogue matters, but cannot be sized cleanly.