Estimated £2m to filed £108m
Three economists left NERA London in April 2002 and set up a competition-economics boutique from scratch. 23 years later, the firm they built works out of the 11th floor of 199 Bishopsgate and reports a £5.77 million highest-paid-member line, the highest disclosed sum visible in this project's pure-play economics-boutique sample.
The managing-partner era
By the spring of 2025, RBB Economics LLP had 18 partners, revenue of £108 million, and an 11th-floor office at 199 Bishopsgate in the City. In the 12 months to 31 March of that year, RBB Economics LLP note 8 reported £5,771,775 for the member with the largest entitlement to profit. No larger highest-paid-member disclosure is visible in this project's pure-play economics-boutique sample. The highest-paid member at A&M Europe LLP earned more in absolute terms, but A&M is a 73-member Europe-wide, multi-practice LLP turning over €301 million. RBB's highest-paid-member line sits inside a partnership of 18 people on £108 million of revenue. From a single floor in the City.
How the number got there is a 23-year story, told through the accounts filed at Companies House since the current LLP entity (OC315356) was incorporated on 26 September 2005, stitched to the three-and-a-half-year narrative that precedes it from the founding practice's first day of trading in April 2002.
The 23-year revenue curve
The revenue curve since inception, with the number of LLP members shown as orange bars and profit per partner as a dashed line, has three distinct phases, and each phase has its own story.
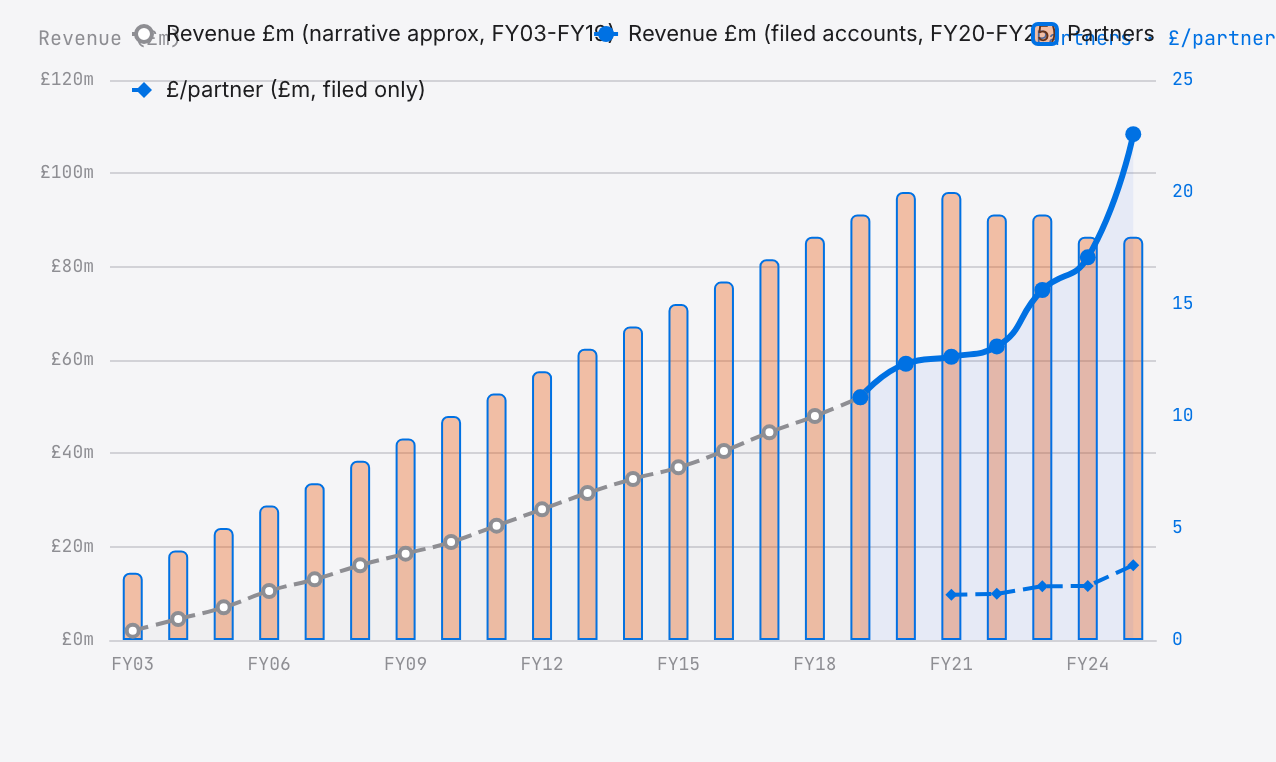
Source note. Points for FY21 to FY25 are taken directly from RBB Economics LLP filed accounts at Companies House (company number OC315356). The FY20 point (£59.2m) is the filed prior-year comparative from the FY21 accounts. Points for FY03 to FY19 are a narrative approximation built from the firm’s own published history, Global Competition Review coverage of the 2002 NERA spinout, and press reporting of partnership growth. Filed pre-FY21 accounts exist in the Companies House filing history; the FY03–FY19 curve should be read as directional rather than audited, and drift of a few million pounds at any individual point is likely.
Phase 1: The slow start (2002–2010)
RBB says it was founded in 2002 by Derek Ridyard, Simon Bishop and Simon Baker, the three formerly of NERA's London office, and started with 16 people, including Andrea Lofaro. The £2 million starting point used in this article is an estimate for the pre-current-LLP trading period, not a Companies House turnover row; the filed-account series used for the hard quantitative claims begins later and the FY25 endpoint is RBB Economics LLP's filed £108.4 million turnover.
Through the rest of the 2000s the firm grew steadily but not spectacularly. By the end of 2010, revenue was roughly £25 million and the partnership counted about eight. The centre of gravity was European competition policy, merger control and cartel damages, and the cases that defined the early RBB were Commission-referral mergers, in which DG COMP at Brussels asked the firm to review the economics submitted by the opposing side, and cartel follow-on damages claims in the English courts.
Through this phase, RBB was one of several boutiques jostling for work in a quietly expanding market. Oxera was bigger. Compass Lexecon, which formed in 2008, rapidly became bigger still. NERA London was still the most visible incumbent brand, at least by name. For this article, the later filed-account series frames the interesting question: what happens to a competition-economics firm that deliberately keeps its partnership small while the market grows around it.
Phase 2: The professionalisation (2011–2020)
In 2011 two things changed at once. The first was an upheaval in the competitive field: LECG went bankrupt, scattering its European alumni; Berkeley Research Group, founded by David Teece a year earlier in 2010, absorbed many of them. The second was that Compass Lexecon, now flush with a wider merger pipeline, began to outpace RBB on European volume. RBB's filed numbers point in a different direction: a tighter partnership rather than a volume race.
Over the next decade, the firm added about one new partner a year and grew revenue from roughly £25 million to roughly £60 million; profit per partner moved steadily from about £1 million to about £2 million. In the same decade, RBB did not open new offices aggressively; Helsinki, Milan, Oslo, Singapore and Sydney came later. It did not dilute the partnership. It did not take external investment. It did not sell to a larger group. It kept what it had.
By 2020 RBB had become a deliberately boutique firm in a market where several comparators were getting bigger. Compass Lexecon, now an arm of FTI, was an 800-plus-economist global network. Baringa had crossed £200 million of revenue and a hundred partners. Frontier was employee-owned and spreading its profit across more than 300 staff. RBB's filed rows imply roughly £2 million of profit per partner around the FY21 starting point, with the FY20/FY21 accounting-policy caveat explained below.
Phase 3: The profit-per-partner explosion (2021–2025)
FY21 to FY25 is where the chart breaks. Over those five years, revenue grew nearly 80 per cent, from £60.7 million to £108.4 million; the partnership shrank from 20 members to 18; and profit per partner rose 65 per cent, from £2.02 million to £3.34 million. The three numbers are doing different kinds of work.
A note on the break itself. Part of the visible step-change at FY21 is an accounting reclassification rather than a commercial transformation. RBB's FY20 accounts (year ended 31 March 2020) charged £41.7 million of members' remuneration as an expense above the operating-profit line, leaving zero available for discretionary division among members. The FY22 filing (year ended 31 March 2021) restated FY20 with £0 above the line, and from that point onward the whole profit-for-members has been treated as an appropriation of equity rather than a cost. After the policy change the headline operating margin jumped mechanically, even on underlying economics that had not moved. The 65 per cent growth in profit-per-partner from FY21 onward is real, revenue did grow 79 per cent, the partnership did shrink, and the distributable pool did widen, but the FY20/FY21 discontinuity visible on any historical margin chart should not be read as an overnight commercial transformation. The three decisions below did the commercial work.
How is that possible? The mechanical answer is that revenue grew faster than both costs and partnership size. The richer answer is that three choices visible in the 2021-2025 evidence set help explain the arithmetic, and the closest comparators in this project sample do not show the same combination.
The first was to open five new offices in 2023, Helsinki, Milan, Oslo, Singapore, Sydney, while the disclosed LLP-member count did not expand. The second was a slow partner-count cadence: despite rapid revenue growth, the filed member count stayed at 20 in FY21, then moved to 19 and 18. The third was attrition without immediate replacement. The partnership went from 20 members to 18. That is the numerator story.
Combine the three moves. An 80 per cent revenue increase lands on a ten per cent smaller partnership. That is the arithmetic of £3.34 million per partner.
Why RBB is different from everyone else
The clearest way to see what RBB has done is to lay the firm's five-year trajectory from FY21 to FY25 alongside Baringa Partners', a useful contrast because both firms disclose enough LLP data to compare revenue, members, and profit per member.
| Metric | RBB FY21 | RBB FY25 | Baringa FY21 | Baringa FY25 |
|---|---|---|---|---|
| Revenue (£m) | 60.7 | 108.4 | 201.9 | 449.8 |
| Partners (LLP members) | 20 | 18 | 98 | 178 |
| Revenue per partner (£m) | 3.04 | 6.02 | 2.06 | 2.53 |
| Profit per partner (£m) | 2.02 | 3.34 | 0.90 | 0.91 |
| 5y revenue growth | +78.6% | +122.8% | ||
| 5y partner growth | −10.0% | +81.6% | ||
| 5y profit-per-partner growth | +65.3% | +1.1% | ||
The bottom row is the comparison that matters. Baringa grew its revenue faster than RBB did over the same five years; its business is healthy. But Baringa also grew its partnership by 82 per cent. Each new partner is a smaller share of a larger pie, and in Baringa's case the arithmetic worked out almost exactly. A Baringa partner in 2025 earns roughly what a Baringa partner earned in 2021.
An RBB partner in 2025 earns 65 per cent more than an RBB partner earned in 2021. Same five-year window, same broad UK consulting cycle, different partnership arithmetic. Two firms made opposite decisions about how to divide the growth.
The highest-paid member question
The £5.77 million figure exists in public view because RBB files it. UK LLP rules require disclosure of the aggregate compensation of members and the number of members, and require disclosure of the highest-paid member's share when that member's remuneration is materially above the average for the firm. Many LLPs do not show an equivalent line item.
RBB, for reasons it does not explain, files the specific figure. In FY25 the number is £5.77 million. It is the line item that generates the "highest visible in this project's detailed-account sample" framing used in this article, and the qualifier visible is doing work. Other partnerships may pay individual partners more, but they do not necessarily disclose member-level remuneration in a form that permits a clean comparison.
The accounts do not name the recipient. The rule applies when one member's remuneration is materially above the average, and the pattern in RBB's recent filings shows a highest-paid-member line in several consecutive years.
How does the figure compare to the rest of the market?
| Firm / role | FY24–25 pay (£m) | Source type |
|---|---|---|
| RBB Economics, highest-paid member | 5.77 | Filed accounts, disclosed |
| A&M Europe LLP, highest-paid member | ~11.8 | Filed accounts, disclosed (EUR 14.2m) |
| Slaughter and May, equity partner (average) | ~3.5 | The Lawyer UK200 PEP reports (paywalled) |
| Kirkland & Ellis London, senior partner (estimate) | ~4–6 | American Lawyer Am Law Global 200 PPP surveys; London-specific pay not disclosed |
| Baringa Partners LLP, highest-paid member | ~11.3 | Filed accounts, derived (7% of £161.9m profit) |
| PwC UK, equity partner (average) | ~1.1 | PwC UK Annual Report FY24 (aggregate partner profit ÷ partner count) |
| Goldman Sachs London, MD base + bonus | ~1.5–3.0 | Industry estimate; no primary UK disclosure |
Sourcing note. Rows 1, 2 and 5 (RBB, A&M Europe, Baringa) are drawn directly from Companies House filed accounts. The remaining rows are industry estimates: PEP figures for UK law firms come from the annual UK200 surveys; Kirkland & Ellis does not disclose London-specific partner pay; PwC UK discloses an average partner profit figure each year in its Annual Report; the Goldman Sachs range is indicative and not drawn from UK filings. Use the first two rows and the Baringa-derived row for quantitative comparisons; treat the rest as context.
On a per-person basis, among pure-play economics boutiques that publicly file detailed accounts, this places RBB at the top, a position held by a firm with almost no public profile outside the small world of competition economics.
Three structural risks to the RBB model
The RBB model is, by any measure, extraordinary. It also carries structural risks. Three of them could end it.
1. Another spinout
RBB exists because three senior economists left NERA in 2002 and founded a specialist competitor. The lesson of that event is that a senior team can leave and create a credible rival. A four-person departure from RBB's 18-partner structure would be a 22 per cent hit to the partnership, and if the four happened to include leaders on major cases, the revenue hit could be larger still. The firm's own founding is the reason this is a live risk.
And yet, in the 23 years since that founding, this project has not identified a comparable senior-partner RBB spinout. Several other firms in the dataset have lost senior economists to new ventures, and one plausible explanation for RBB's visible stability is arithmetic. At £3.34 million per partner, a spinout founder would need to build a large new practice simply to match the compensation already in hand.
2. A big hire that dilutes the ratio
The profit-per-partner number would compress if RBB started promoting heavily or recruiting senior economists from the outside. This is the Baringa story told in reverse. Each additional partner is a decision by the existing partnership to accept a smaller share of the pie, and a firm with 18 members sitting around a £60 million profit pool is unlikely to make that decision casually.
The test case is what RBB does when a genuinely strong senior economist becomes available. In the Part 6 move set, the named CMA leavers went to Keystone, Frontier, Oxera, and AlixPartners, not to RBB. The signal is ambiguous. Either the firm is not bidding, or senior external hires believe the closed partnership has little room for them. Either reading is a long-term risk.
3. A change in the disclosure rules
The £5.77 million line item exists under UK LLP disclosure rules for a highest-paid member whose share is materially above the average. If those rules changed to allow aggregate disclosure without that line, this specific public comparison would vanish. RBB would still be profitable. It would simply become less visible. That is a disclosure risk, not a forecast.
What RBB tells you about the next 20 years
Two observations, both uncomfortable for the rest of the market.
First: the small-partnership model is the most profitable model visible in this sample. RBB's £3.34 million profit per partner is nearly four times Baringa's £0.91 million and more than three times Frontier's employee share of profit. The model that looks unfashionable, small LLP, minimal partnership dilution, no outside capital, no sale to a larger group, is the model that has won the arithmetic in the filings this project can see. Firms that expanded the partnership to chase scale, from Baringa to AlixPartners, have traded profit per head for growth. RBB has done the opposite.
Second: the private-equity story told in Part 5 of this series is a different business from the RBB story. When Part 5 discusses Cinven's Flint Global transaction, the important distinction for this RBB comparison is not the exact reported price; it is that the valuation was for a platform that could grow. When Phoenix Equity Partners paid £95 million for Capital Economics in 2018, it was paying for a subscription-research machine that could be leveraged. Neither deal was the RBB model. The private-equity money visible in this project's deal file is buying growth-stage firms and platforms, not small cash-cow partnerships. The two models can co-exist without converging.
The commercial question for RBB's competitors is whether the rest of the market can tolerate being consistently out-earned by an 18-partner boutique on a single floor in the City. The CMA drain covered in Part 6 and the 2002 NERA spinout covered in Part 2 are examples of the same pressure: senior economists move when the institutional home no longer fits their incentives. This article treats the visible pay gap as one reason the breakaway incentive becomes easier to understand. Econic Partners' 2025 exit from Compass Lexecon is another case in point.
Key takeaways
- RBB Economics grew from an estimated £2 million of revenue in 2002 to £108.4 million in FY25. The FY25 accounts show 18 partners, £3.34 million of profit per partner and a highest-paid-member line of £5.77 million.
- Between FY21 and FY25, RBB grew revenue 79 per cent while shrinking the partnership from 20 to 18; profit per partner grew 65 per cent. Baringa, over the same five years, grew revenue by 123 per cent and profit per partner by about 1 per cent.
- The five new offices opened in 2023, Helsinki, Milan, Oslo, Singapore, Sydney, expanded the European footprint without diluting the partnership.
- In 23 years, this project has not identified a comparable senior-partner RBB spinout. At £3.34 million each, the opportunity cost of leaving is high.
- The £5.77 million FY25 highest-paid-member figure is the largest this project documents for a UK economics consultancy that is not itself a multi-practice advisory group. Baringa Partners LLP, a broad advisory firm, discloses a derived top share of roughly £11.3 million; A&M Europe LLP, a multi-practice Europe-wide partnership, discloses €14.2 million, roughly £11.8 million, on a materially larger revenue base. RBB is therefore not the single highest-disclosed top earner in the dataset. It is the largest figure visible in this project's small, pure-play partnership comparison, the comparison used in this article.
- The small-partnership model is the most profitable per head visible in the project sample. The private-equity money visible in the project deal file is buying a different business from the RBB model, not the same business at scale.